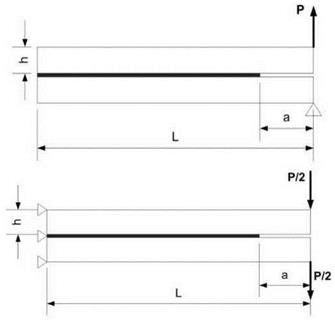
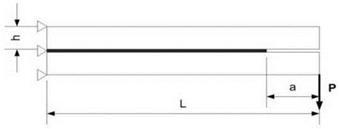
The CZM fatigue debonding model was tested on various joint geometries characterised by different mixed mode ratios, in order to verify accuracy, robustness and performance in terms of computational time. In particular, pure mode I loading was simulated with a Double Cantilever Beam (DCB) geometry, pure mode II loading with an End Loaded Split (ELS) geometry and mixed mode I/II loading with a Mixed Mode End Loaded Split (MMELS) geometry, as shown in Figure 6. The applied force and the specimens dimensions are given in Table 1. In order to investigate the model sensitivity to material behaviour, two kind of materials were simulated, one representing an elastic, isotropic aluminum alloy and another one an elastic, orthotropic composite laminate (see. Table 2). In all the simulations a load ratio R = 0 is assumed.
|
|
|
Figure 6. Simulated geometries: a) DCB, b) ELS, c) MMELS and d) SLJ. |
|
Table 1. Specimen dimensions and applied load per unit thickness
|
The adherend were meshed with 3D Continuum Shell elements and the cohesive elements were kinematically tied to the two delaminating halves. The cohesive element size was 0.5 mm (CZM), while continuum shell elements were 1 mm in the direction of propagation, in order to keep computation time within a reasonable value. The maximum damage increment was taken ADmax = 0.2, based on the sensitivity analysis done in [28]. The increment in crack length per increment in analysis time came as a result of in the increment in damage AD, therefore it is not generally constant as AD may vary from increment to increment according to Eq. (26). However, the average increment in crack length ranged from 0.1 to 0.5mm in the various cases simulated in this work.
|
Table 2. Elastic constants, cohesive zone parameters and FCG behaviour for mode I, mode II, and mixed mode I/II [12], [27]
|
 17 января, 2016
  Pokraskin

 Опубликовано в рубрике