There is usually very little accurate durability data available for the bonding of engineering plastics and it has to be admitted that the specialist adhesive engineers
|
Environmental resistance
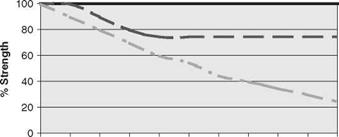
100 200 300 400 500 600 700 800 900 1000 Time (hours) Figure 9.8 Three possible results from an environmental test |
can usually only offer the design engineer the benefit of experience rather than all the data they yearn for. The data supplied on the adhesive technical data sheet can only be used as an initial starting point and it can be very difficult to cross-refer the data to the actual application for the end user.
Every adhesive application is different and much of the data have to be gained by laboratory testing.
It is often the case that a bonded part will show some signs of failure within the first 1000 hours in a severe environment. Figure 9.8 demonstrates the interpretation of the various outputs of an environmental test.
Figure 9.8 is a schematic diagram showing three possible outcomes from a series of environmental tests. The ideal result would be ‘A’, i. e., there has been no degradation in strength (or performance) of the adhesive bond after environmental cycling. Result ‘B’ may be acceptable in as much as that whilst there has been some deterioration in strength (or performance) of the adhesive bond it essentially has stabilised and the final strength may well still be acceptable for the intended application. Result ‘C’ is clearly unacceptable as the adhesive bond performance has continued to fall.
 5 января, 2016
  Pokraskin
 Опубликовано в рубрике