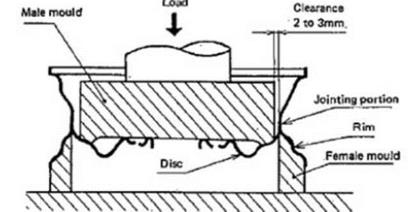
The wheel shear test provides precise information on the shear resistance of the wheel joint. In this test, the disk is pulled out from the rim that cannot be plastically deformed, because of constraints. Also the disk is not able to deform as the load acts on a disk shaped mold placed inside it. Thus, in this way, all the plastic deformations are avoided and all the stresses are concentrated in the joint area, as can be seen in the schematic representation of figure 15.
|
Figure 15. Schematic representation of the shear test on wheel (M. W. Italia SpA, n. d.). |
A minimum of five bonded wheels for each case (A, B and C) were submitted to the shear test. On the basis of the laboratory tests on the hub/haft samples, the increase in the interference should imply an increment in the shear strength. On the contrary, the shear tests on bonded wheels revealed an opposite trend, as illustrated in figure 16 where the shear strength is plotted against the maximum fitting force. The shear decoupling load of the case C (the transition fit) was the highest; on the contrary, the case A, characterized by the highest interference, showed the poorest results.
 |
The reason of these unexpected results was explainable through the fractographic analysis of the wheel bonded areas. Discs and rims were cut and analyzed at the optical microscope. A typical fracture surface for each case study is illustrated in figure 17.
When the disc was coupled into the rim, the adhesive deposited on both the surfaces was dragged. The inclination of the disc combined with the enlargement of the rim due to plastic deformations created a clearance inside the junction. On the contrary, the extremities of the joint area were characterized by a higher interference.
An higher UFD interference level limited the adhesive penetration inside the joint. A very limited contact area involving both the adhesive and the interference was present in the case A. The adhesive residues showed a clear fracture surface not in the whole mating area, but only in restricted circumferential stripes at the height of UFD and LFD. A different situation was observed in the samples B that were characterized by a wider fracture surface in correspondence of the LFD. A relevant quantity of adhesive was able to flow inside the junction during the press-fit thank to the lower interference at the UFD. The adhesive was then accumulated at the end of the joint gathered by the LFD interference. The non-contact area was present also in these samples, but with reduced dimensions with respect to the case A. In the case C, thanks to the clearance at the UFD level the adhesive gathered by the interference at the LFD level was more than in the case B.
The higher loads reached in shear in the case C seemed plausible considering the quantity of glue that actually formed the bonded joint inside the mating surfaces. The adhesive contribution could be considered higher in the samples B and C than in the case A. It is then possible to resume that samples with higher interference levels showed less shear strength values because they were characterized by a considerably lower adhesive contribution.
 9 октября, 2015
  Pokraskin
 Опубликовано в рубрике