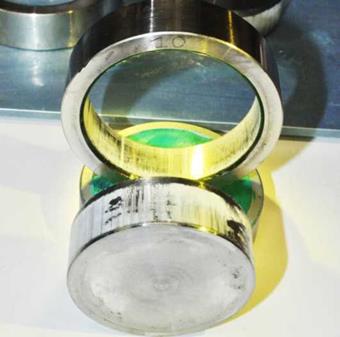
The results are collected in the following tables: Table 6 refers to press-fit couplings assembled at R. T. without adhesive, while Table 7 refers to press fit couplings assembled at R. T. and reinforced with adhesive. Table 8 refers to shrink fit couplings with adhesive and hubs heated at +180°C and Table 9 refers to cryogenic fit couplings with adhesive and shafts cooled at -150°C. From suitable elaboration of the data relevant to press-fit couplings assembled at R. T., it is possible to evaluate the mean coefficient of friction between the mating surfaces during disassembly, which, by assuming an engaged area A=2,454 mm2, is p=0.207 (standard deviation 0.035). Then, the frictional contribution for a given coupling can be calculated with Eq. (2). Referring, for example, to press-fit shaft hub specimens (Table 7), it can be calculated a mean adhesive shear strength of Tad_mean=22.9 MPa with a standard deviation of 3.4 MPa (mean coupling pressure of 5.4 MPa). Both the friction coefficient and the Tad_mean values are aligned with the data shown in [12] for steel-steel couplings. It is confirmed that, in the case of steel-steel couplings, the frictional contribution to the overall push-out force of HJs is negligible if compared to the contribution of the adhesive. As for the shrink-fit process, referring to Table 8, a mean coupling pressure p= 15.8 MPa can be calculated according to Croccolo et al. [1]. Therefore, by assuming a friction coefficient p=0.207 and an engaged area A=2,454 mm2, the frictional contribution can be calculated as for Eq. (2). Then, a mean adhesive shear strength of Tad_mean=34.7 MPa can be retrieved, with a standard deviation 2.8 MPa. Such a shear strength is greater than the minimum suggested by the data sheet of the adhesive as well as greater than that shown above for pin-collar specimens, heated and with no interference. In fact, it has been shown recently by Castagnetti and Dragoni [17] that anaerobic adhesives increase their strength if combined with a moderate coupling pressure (a moderate interference). A possible explanation to this occurrence is that a thin film of adhesive is retained in the surface roughness of the mating parts, regardless of the coupling pressure level: in analogy to what happens for regular polymers, if high local pressure is applied, that film can build up a greater shear strength than that at ambient pressure [18]. Figure 5 shows the fracture surface of two shrink-fit shaft-hub specimens: the failure mode is again cohesive, and the adhesive residue is uniformly distributed over the whole mating surfaces.
|
Figure 5. Shaft-hub specimen assembled by shrink fitting at +180°C, after pushout. |
|
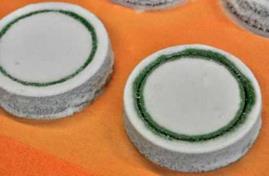
Figure 6. Shaft-hub specimens assembled by cryogenic fitting at -150°C, just after coupling. |
As for cryogenic fitted shaft-hub specimens a mean coupling pressure of 8.6 MPa can be calculated from data retrieved by Table 9. The mean adhesive shear strength is therefore Tad_mean=13.2 MPa, with a standard deviation of 4.6 MPa. Such shear strength is lower than the minimum suggested by the data sheet of the adhesive. On the contrary, if compared to pin-collar specimens assembled with clearance after cooling the collar at -20°C, the result in terms of adhesive shear strength is higher in the presence of interference, which confirms what was stated above about the beneficial effect of coupling pressure. After cryogenic fit assembly, a considerable amount of frost builds up on the specimen surface (Figure 6). ‘
|
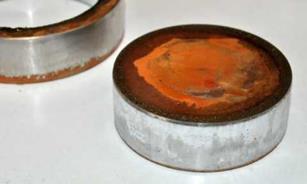
Figure 7. Fracture surface of a shaft-hub coupling assembled by cryogenic fitting at — 150°C. |
Figure 7 shows the fracture surface of a cryogenic fitted shaft-hub specimen. The surface is quite inhomogeneous, with some areas characterized by adhesive failure and others showing cohesive failure. It can be appreciated from Figure 7 that the frost flourished on the specimens causes a growth of rust on the surfaces.
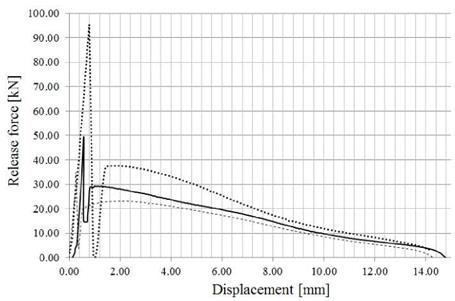
The remarks mentioned above are summarized in Figs. 8-10. Figure 8 shows the full push-out stroke for three shaft-hub specimens: ID5 (dash-dot line) assembled by shrink fit, ID29 (dashed line) assembled by cryogenic fit, and ID23 (solid line) assembled by press fit with adhesive. The assembly interference was similar for the three specimens (see Tables 7-9), therefore its contribution to the overall strength of the joints can be considered equal among the three tests. Moreover, it can be appreciated how the initial elastic part of the push-out curves is quite different among the three tests, because it is mostly influenced by the adhesive strength. On the contrary, the subsequent descending part related to the frictional contribution, is similar for the three curves.
|
Figure 8. Comparison of static shear strength of shrink fit ID5 (dotted line), cryogenic fit ID29 (dashed line) and press fit ID23 (solid line) specimens. |
Figures 9 and 10 report histograms relevant to the shear strength of the different joints, taking into account the sole adhesive contribution and the overall shear strength of the joint, respectively. Looking at Figure 9, it can be appreciated how the joints of bigger size (shaft-hub specimens) assembled by press-fitting at R. T., have a lower shear strength than pin-collar specimens assembled with clearance at R. T. This occurrence may be explained by observing that, during the press fit operation, a certain amount of adhesive is stripped away from the mating surfaces, thus reducing the actual bonded area. Moreover, Figure 9 shows that both shrink fit and cryogenic fit shaft-hub joints have a higher adhesive shear strength than pin-collars assembled with comparable temperature differentials. It must be remarked that shaft-hub joints are assembled with interference while pin-collars are assembled with clearance. To some extent, this occurrence confirms the beneficial effect of pressure on the adhesive shear strength. Finally, looking at the left side of Figure 9, it can be seen that both shrink fitting and cryogenic fitting determine a decrease of the shear strength of the adhesive with respect to clearance fitting at R. T. The effect is much more pronounced in the case of cryogenic fitting. Figure 10 shows how, in the case of steel on steel HJs, the frictional contribution to the overall shear strength of the joint is negligible with respect to the adhesive contribution.
|
Оч |
|||||||||||||
|
r—J Aj iV to |
rh |
||||||||||||
|
j _ _ |
|||||||||||||
|
o 15.0 Ї, |
|||||||||||||
|
w 10.0 CJ____ |
|||||||||||||
|
5.0 T3 |
rb |
||||||||||||
|
^ o u ^ o u nS © о & о о “ ОС Сії!“ oo «о rt Vі ‘ rt 1-1 ‘T1 t a * .= X) ® £ b 3 % — н-t j- О Уі 1______ “___________ 11__________ |
|
Pin-collar (clearance) Shaft-hub (interference) |
Figure 9. Adhesive shear strength: clearance fits vs. interference fits.
|
_ 45 |
||||||||
|
__ |
||||||||
|
і |
||||||||
|
bb ^ |
||||||||
|
g 25 _ _ |
T |
► |
||||||
|
й 2a |
||||||||
|
m in |
, |
|||||||
|
о U J H |
1—1-1 |
|||||||
|
at R. T. at R. T. Hub at+180°C Shaft at-15CPC |
||||||||
|
Dry With adhesive |
Figure 10. Total shear strength: dry vs. adhesively bonded shaft-hub specimens.
|
Table 6. Results for shaft-hub specimens assembled with interference and without adhesive
|
|
Table 7. Results for shaft-hub specimens assembled by press fitting with adhesive
|
|
Table 8. Results for shaft-hub specimens assembled by shrink fitting with adhesive
|
|
Table 9. Results for shaft-hub specimens assembled by cryogenic fitting with adhesive
|
 10 сентября, 2015
  Pokraskin
 Опубликовано в рубрике