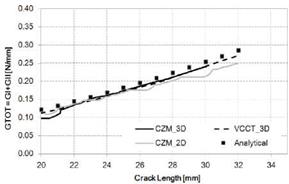
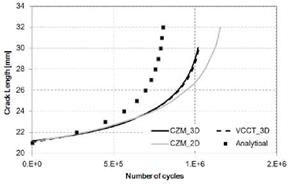
Figure 10. Comparison of (a) Gn and (b) da-dN obtained by CZM 2D, CZM 3D, VCCT 3D and analytical solution [30] in the case of ELS aluminum joints.
Some differences concern the 2D CZM, that gives a trend slightly lower than the other models, and the VCCT, whose trend that is rather jagged: probably this is related to a non-uniform (one row of elements per time increment) crack front propagation that has been recorded in the simulation.
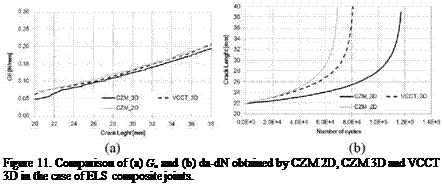
The results in terms of crack length vs. number of cycles are shown instead in Figure 10 (b), where differences come out lower than mode I (18% at 39 mm crack length); also in this case a further mesh refinement can get the four models closer to each other.
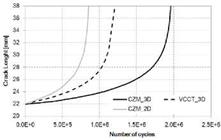
In the case of composite adherend the three models analyzed are again in good agreement between each other. Concerning the strain energy release rate plot (Figure 11 (a)), the CZM_3D trend is quite lower than the other; however the differences are, in the average, lower than 7%. In terms of crack length vs. number of cycles prediction (Figure 11 (b)), this produce similar results for CZM_2D and VCCT, while the CZM_3D yields a higher fatigue life with respect to the others (about 55% for a propagation from 22 to 36mm). The strain energy release rate plot of mode II composite joints appear less scattered with respect to the mode I composite joints: this is due to the lower stress concentration in the ELS joints (respect to the DCB), which produces smaller changes of the stress field when one or more elements change form "undamaged" to "damaged".
|
|
|
|
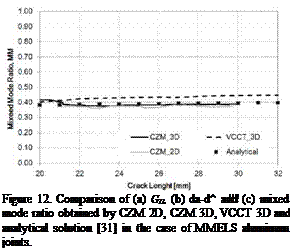
Figure 12. (Continued).
![]()
 |
|
|
|
 |
|
 20 января, 2016
  Pokraskin
 Опубликовано в рубрике