In the case of aluminum joints, the four models show the same overall trend and an overall good correspondence with each other of the SERR plot, Figure 8 (a); in general the VCCT yields slightly lower values than the two CZM and analytical model. Moreover both the CZMs show a quite different trend in the first millimeter, where the process zone is under development. The average difference between the VCCT and the CZMs is about 5% on the 21-29 mm crack length span, while the difference is in the order of 2% whit respect to the analytic solution. As a consequence, the crack growth predictions given by the CZMs are rather similar to that given by the analytical model (Figure 8 (b)).
Due to the differences shown in the SERR plot, the VCCT model gives a slight under-prediction of the crack growth rate with respect to the CZMs and analytical model. It is believed that further mesh refinement can get the two models closer to each other.

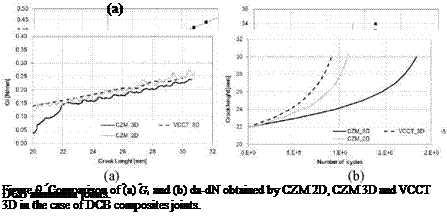
Moving to the analysis of composite joints (Figure 9), the presence of an anisotropic behavior of the adherends increases the differences between the three models.
In particular, for the strain energy release rate evaluation, the trends of the CZMs are more scattered (Figure 9 (a)): this is due to the continuous changes produced in the stress field at the crack tip by the combination of adherends anisotropy and stepwise element deletion.
However a good agreement can be noticed for the three plots, although the CZM_3D curve is slightly lower than the other (differences in the order of 12%). These differences produce a significant under prediction of the crack growth rate in the case of CZM_3D with respect to CZM_2D and VCCT (Figure 9 (b)).
 19 января, 2016
  Pokraskin
  Опубликовано в рубрике