Vibrational spectroscopy has been widely used to identify polymers, to quantitatively analyze chemical composition, and to specify configuration, conformation, branching, end groups, and crystallinity. Chemical reactions including polymerization, curing, crosslinking, degradation, and weathering have been studied using vibrational techniques.
Light, which is a form of electromagnetic radiation, can interact with matter in a number of different ways. The interaction of light of a given wavelength with a particular object depends on the molecular structure of the object. Incident light may be transmitted, reflected, absorbed, or scattered by the molecules. Infrared (IR) spectroscopy is a particular type of absorption spectroscopy whereas Raman spectroscopy arises via the inelastic scattering of photons by molecules of the object. Both the structure and the electronic distribution of the molecule determine the intensity of a vibrational transition for each technique. In this sense, the methods may be considered to be complementary, and in some cases a combination of both may prove to be especially useful [14,15].
Infrared spectroscopy is the fastest and cheapest of the spectroscopic techniques used by organic and polymer chemists. As indicated, it is the measurement of the absorption of IR frequencies by organic compounds placed in the path of the beam of light. The samples can be solids, liquids, or gases and can be measured in solution or as neat liquid mulled with potassium bromide (KBr) or mineral oil. Recent developments in attenuated total reflection (ATR) and diffuse reflectance techniques have made the analysis of solid adhesives possible. In fact, for bulk samples or powders, the reflectance technique is probably more suitable than transmission.
Infrared radiation is electromagnetic radiation in the wavelength range that is adjacent to and of less energy than visible radiation. The IR region starts at a wavelength of about 0.7 pm and ends at a wavelength of about 500 pm. Many chemists refer to the radiation in the vibrational IR region in terms of a unit called wavenumbers (v), which is the number of waves of the radiation per centimeter (cm-1).
While molecules absorb radiation, some parts of the molecule (i. e., the component atoms or group of atoms) vibrate at the same frequency as the incident radiant energy. After absorbing radiation, the molecules vibrate at increased amplitude. When molecular vibrations result in a change in the bond dipole moment, as a consequence of a change in the electron distribution in the bond, it is possible to stimulate transitions between energy levels by interaction with electromagnetic radiation of the appropriate frequency. In effect, when the vibrating dipole is in phase with the electric vector of the incident radiation, the vibrations are enhanced and there is transfer of energy from the incident radiation to the molecule. It is the detection of this energy absorption that constitutes IR spectroscopy. The complex motions of the atoms in a molecule due to the twisting, bending, rotating, and vibrating actions produce an absorption spectrum that is characteristic of the functional groups comprising the molecule and of the overall molecular configuration as well. Thus, IR spectroscopy readily distinguishes between aliphatic and aromatic compounds. Table 1 gives characteristic IR absorption bands for some functional groups.
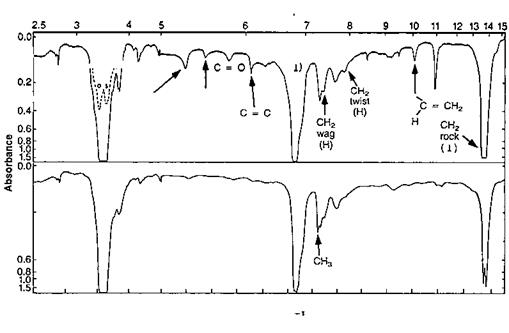
Several collections of spectra are available [17-21]. The total structure of an unknown may not be readily identified from the IR spectrum, but perhaps the type or class of compound can be deduced. Once the key functional groups have been established as present (or, equally important, as absent), the unknown spectrum is compared with spectra of known compounds. As an example, consider polyethylene. There are at least three types of carbon-hydrogen groups in polyethylene: methyl, — CH3; methylene, — CH2-; and tertiary carbons, — CHR-. The methyl groups appear at the ends of a chain and its
|
Frequency |
Wavelength |
|||
|
Type of vibration |
(cm-1) |
(mm) |
Intensitya |
|
|
C-H |
Alkanes (stretch) |
3000-2850 |
3.33-3.51 |
s |
|
-CH3- (bend) |
1450 and 1375 |
6.90 and 7.27 |
m |
|
|
-CH2- (bend) |
1465 |
6.83 |
m |
|
|
Alkenes (stretch) |
3100-3000 |
3.23-3.33 |
m |
|
|
(out-of-plane bend) |
1000-650 |
10.0-15.3 |
s |
|
|
Aromatics (stretch) |
3150-3050 |
3.17-3.28 |
s |
|
|
(out-of-plane bend) |
900-690 |
11.1-14.5 |
s |
|
|
Alkyne (stretch) |
ca. 3300 |
ca. 3.03 |
s |
|
|
Aldehyde |
2900-2800 |
3.45-3.57 |
w |
|
|
2800-2700 |
3.57-3.70 |
w |
||
|
C-C |
Alkane (Not interpretatively |
|||
|
useful) |
||||
|
C = C |
Alkene |
1680-1600 |
5.95-6.25 |
m-w |
|
Aromatic |
1600 and 1475 |
6.25 and 6.78 |
m-w |
|
|
C = C |
Alkyne |
2250-2100 |
4.44-4.76 |
m-w |
|
C = C |
Alkyne |
1740-1720 |
5.75-5.81 |
s |
|
Ketone |
1725-1705 |
5.80-5.87 |
s |
|
|
Carboxylic acid |
1725-1700 |
5.80-5.88 |
s |
|
|
Ester |
1750-1730 |
5.71-5.78 |
s |
|
|
Amide |
1670-1640 |
6.00-6.10 |
s |
|
|
Anhydride |
1810 and 1760 |
5.52 and 5.68 |
s |
|
|
Acid chloride |
1800 |
5.56 |
s |
|
|
C-O |
Alcohols, ethers, esters, |
1300-1000 |
7.69-10.0 |
s |
|
carboxylic acids, anhydrides |
||||
|
O-H |
Alcohols, phenols |
|||
|
Free |
3650-3600 |
2.74-2.78 |
m |
|
|
H-bonded |
3500-3200 |
2.86-3.13 |
m |
|
|
Carboxylic acids |
3400-2400 |
2.94-4.17 |
m |
|
|
N-H |
Primary and |
3500-3100 |
2.86-3.23 |
m |
|
secondary amines and amines (stretch) (bend) |
1640-1550 |
6.10-6.45 |
m-s |
|
|
C-N |
Amines |
1350-1000 |
7.4-10.0 |
m-s |
|
C = N |
Imines and oximes |
1690-1640 |
5.92-6.10 |
w-s |
|
C = N |
Nitriles |
2260-2240 |
4.42-4.46 |
m |
|
X = C=Y |
Allenes, ketenes, |
2270-1950 |
4.40-5.13 |
m-s |
|
isocyanates, isothiocyanates |
||||
|
N = O |
Nitro (R-NO2) |
1550 and 1350 |
6.45 and 7.40 |
s |
|
S-H |
Mercaptans |
2550 |
3.92 |
w |
|
S = O |
Sulfoxides |
1050 |
9.52 |
s |
|
Sulfones, sulfonyl |
1375-1300 and |
7.27-7.69 and |
s |
|
|
chlorides, sulfates, sulfonamides |
1200-1140 |
8.33-8.77 |
s |
|
|
C-X |
Fluoride |
1400-1000 |
7.14-10.0 |
s |
|
Chloride |
800-600 |
12.5-16.7 |
s |
|
|
Bromide, iodide |
<667 |
>15.0 |
s |
|
as, Strong; m, moderate; w, weak. Source: Ref. 16. |
Frequency, cm
Figure 8 Infrared spectra of (top) linear and (bottom) branched polyethylene.
branches, the methylenes in the middle of a chain, and the tertiary carbons at the connecting points of chain branches. Each of these groups produces spectral bands that appear at different wavelengths in vibrational spectrometries. Figure 8 illustrates the difference IR absorbance between linear and branched polyethylene. If the baseline is accounted for, then the absorbance of the 1374cm_1 band reflects the methyl content of the specimen.
Infrared instrumentation is divided into dispersive and nondispersive types. Before the advent of the Fourier transform infrared (FTIR) spectrophotometer, a dispersive instrument that depends on gratings and prisms to disperse the IR radiation geometrically was necessary for IR spectroscopy. Most dispersive spectrometers are double-beam instruments. The dispersed IR radiation is passed over a slit system, by means of a scanning device, and thus the frequency range falling on the detector is isolated. The data indicate the amount of energy transmitted through a sample as a function of frequency, and as a result, an IR spectrum can be obtained. However, the sensitivity of the technique is relatively low, because a large percentage of the available energy from the source of radiation does not fall on the open slits and is lost to the technique. Fortunately, the energy limitation can be minimized by using interferometers of the Michelson type rather than the conventional prism and grating instruments. This technique is called FTIR spectroscopy [22].
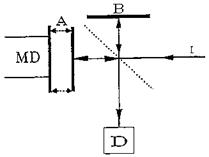
 The Michelson interferometer is shown schematically in Fig. 9. It consists of two mutually perpendicular plane mirrors, one of which can move at a constant rate along the axis and one of which is stationary. Between the fixed mirror and the movable mirror is a beam splitter where a beam of radiation from an external source can be partially reflected to the fixed mirror and partially transmitted to the movable mirror. After each beam is reflected back to the beam splitter, it is again partially reflected and partially transmitted.
|
|
Figure 9 Diagram of a Michelson interferometer: I, unmodulated incident beam; A, moving mirror; B, stationary mirror; D, detector; MD, mirror drive; broken line, beam splitter.
Thus a portion of the beams that traveled in the path to both the fixed and movable mirrors reach the detector. If the two path lengths are the same, no phase difference between the beams occurs, and they combine constructively for all frequencies present in the original beam. For different path lengths, the amplitude of the recombined signals depends on the frequency and the distance the mirror moved. For example, low frequencies interfere destructively (they have a phase shift of 180°) for relatively large movements of the mirror, whereas high frequencies require relatively small movements for this condition to occur. The resulting interferogram contains information on the intensity of each frequency in the spectrum. These data can be calculated by a mathematical operation known as the Fourier transform to yield the IR spectrum.
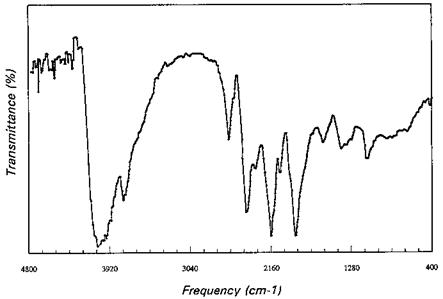
Fourier transform infrared spectroscopy offers a dramatic improvement in the signal-to-noise ratio over dispersive IR spectroscopy due to the multiplexing (or Fellgett) advantage and the throughput (or Jacquinot) gain. The multiplexing advantage arises because all of the resolution elements are observed all the time. The large sampling area and the absence of narrow slits in the interferometer produce the throughput gain. The accuracy of frequency determination (Connes’ advantage) in FTIR, which is made possible by the use of the He-Ne laser interferometer to reference the position of the moving mirror, is another advantage. In addition to the advantages inherent in the interferometric acquisition of the data, the computer, which is an integral part of the system, offers many possibilities for manipulation of the stored data (such as spectral subtraction or addition) to improve the capabilities for rapid and accurate quantitative measurements. Detailed discussions of the principles of FTIR have been given by Bell [22] and Griffiths [23]. The application of FTIR has been popularly used for charcterization of adhesives. Sojka et al. [24] used FTIR to study the reaction of phenol with hexamethylenetetramine (HMTA) at 100°C. Pearce et al. [25] analyzed cured novolak and resol adhesives. Figure 10 shows an IR spectrum of resol. The curing kinetics and mechanism, degradation processes, and chemical reactions of epoxies with coupling agents have also been studied by FTIR [26]. The completeness of the cross-linking reaction for a mixture of epoxy resin and curing agent immediately after being mixed and after being cured at 160 °C for 2.5 h has been studied by Yorkgitis et al. using FTIR [27].
When a beam of radiation encounters an interface between two media, approaching it from the side of higher refractive index, total reflection occurs if the angle of incidence is greater than some critical angle, the value of which is given by
a = sin 1 — (10)
ni
|
Figure 10 The infrared spectrum of a phenol-formaldehyde (resol) adhesive. |
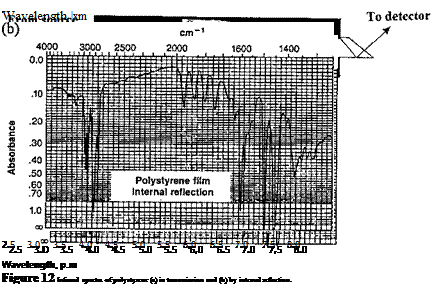
when n1 and n2 are the two indices of refraction, with n1 > n2. Not so generally realized, although predicted by electromagnetic theory, is the fact that in total reflection, some portions of the energy of the radiation actually cross the boundary and return. If the less dense medium absorbs at the wavelength of the radiation, the reflected beam will contain less energy than the incident, and a wavelength scan will produce an absorption spectrum. This principle has been found useful in the IR. The distance to which the radiation appears to penetrate in internal reflection depends on the wavelength but is on the order of 5 pm or less in the mid-IR region. This phenomenon is generally known as ATR [28,29]. This method enables a reflection spectrum to be obtained which is superficially very similar to an absorption spectrum with the only difference being the higher intensities of absorption bands at longer wavelengths. To obtain measurable absorption spectra, it is a normal practice to use multiple reflection prisms (Fig. 11), and these are available as standard spectrometer accessories. A common material for the prisms is thallium bromoiodide (KRS-5). A trapezoidal prism having an angle of incidence of 45° giving 25 reflections is useful for adhesive materials. The sample is clamped securely to provide good optical contact with the prism and, where possible, the sample should be placed on both surfaces of the prism to give optimum sensitivity (see Fig. 11). Attenuated total reflection has been found most useful with opaque materials that must be observed in the solid state. Applications include studies of polymeric materials, adsorbed surface films, paints, and adhesives. Infrared spectra of polystyrene in transmission and by ATR are shown in Fig. 12.
Like IR spectroscopy, Raman spectroscopy can provide qualitative, quantitative, and structural information about a variety of materials. The potential of laser Raman for distinguishing critical structure differences in cured urea-formaldehyde (UF) resins has been demonstrated from studies made on model compounds [30]. Fourier transform — Raman studies of thermally and photochemically induced epoxy curing reactions have been reported [31].
 |
Infrared spectroscopy and Raman spectroscopy are complementary analytical techniques. Both provide vibrational information about the molecule, but different data are conveyed in the absorption and scattering spectra analyzed, respectively, by IR and Raman spectroscopy. In general, the IR spectrum arises from the absorption of radiation the frequency of which is resonant with a vibrational transition, while the Raman effect results from inelastic scattering of photons to leave a molecule in a vibrationally excited
state. The shift in frequency of the scattered photon corresponds to the frequency of the normal mode that has been excited. A particular molecular vibration may be observable in both spectra, but different in intensity. The lower the symmetry of a molecule, the greater the overlap of its IR-active and Raman-activated vibrations. Polar compounds and asymmetric vibrations are more readily observed in IR spectroscopy, whereas Raman spectroscopy favors nonpolar compounds and symmetric vibrations. Furthermore, the Raman-scattered light occurs in the visible and ultraviolet regions of the electromagnetic spectrum and the detection systems in this range are far superior to those in the infrared region. However, the intensity of a Raman spectrum is usually quite weak—it is about one-thousandth of the intensity of the light that is scattered at the same frequency as the incident beam (Rayleigh scattering). Generally, IR spectroscopy yields more useful information for the identification of polar groups, whereas Raman spectroscopy is especially helpful in the characterization of the homonuclear polymer backbone. Thus, the application of both techniques is highly desirable in order to extract the maximum amount of information from an adhesive specimen. The complementarity of the two techniques is illustrated by Fig. 13, which shows the IR and Raman spectra of poly(vinyl acetate). Comprehensive reviews of these techniques are available [14,15,32,33].
 10 июля, 2015
  Malyar
 Опубликовано в рубрике