As noted earlier, the most commonly used standards for determination of adhesive joint properties and characteristics suggest reporting the results in terms, of average stress at failure. If average stress criteria were generally valid, one would anticipate that a doubling of the bond area should result in a proportionate increase in joint strength. Studies in our laboratory demonstrate that such criteria may lead to erroneous predictions [36]. This study involved leaving half of the overlap area unbonded. All of the samples had the same amount of overlap. Part of the samples (the control) were bonded over the complete overlap region. Part of the overlap area near one of the bond termini was without any adhesive and the other part had a 50% unbonded region centered in the overlap region. In neither case was the reduction in strength commensurate with the reduction in bond area. That is, for the end debonds, the reduction in load at failure averaged less than 25% and for the center debonds it was reduced by less than 10%. This is consistent with standards such as ASTM D-3165, Strength Properties of Adhesives in Shear by Tension Loading of Laminated Assemblies, which address the fact that average lap shear strength is dependent on different bond areas of the joint and that the adhesive can respond differently to small bond areas compared to large bond areas.
To determine failure loads for different geometries, other methods are required. This is due to the fact that the stress state in the bond region is complex and cannot be approximated by the average shear stress. A method that is gaining in popularity for addressing this problem is the use of fracture mechanics. With the use of modern computers, the stress state and displacement even in complex adhesive bonds can be determined with good accuracy. A fracture mechanic approach uses these stresses combined with the displacements and strains and conservation of energy principles to predict failure conditions. At least three ASTM standards are based on fracture mechanics concepts (ASTM D-3433, D-3762, and D-5041). The premise behind fracture mechanics is accounting for changes in energies associated with the applied load, the test sample, and the creation of new surface or area. Since fracture mechanics techniques are well documented in the literature (see, e. g., Refs. 37 and 38), only a brief review is presented here.
The methods suggested here are formulated using methods similar to those postulated by Griffith [39]. Griffith hypothesized that all real ‘‘elastic’’ bodies have inherent cracks in them. He hypothesized that a quantity of energy to make the most critical of these cracks grow would need to come from the strain energy in the body and work applied by loads. Conservation of energy dictates that a crack can grow only when the strain energy released as the crack grows is sufficient to account for the energy required to create the new ‘‘fracture’’ surface. In Griffith’s original work, he considered only perfectly elastic systems. He conducted his confirmation experiments on glass, which behaves as a nearly ideal elastic material. In this case the fracture energy is very closely associated with the chemical surface energy. Indeed, Griffith was able to establish such a correlation by measuring the surface tension of glass melts and extrapolating back to room temperature. Most engineering solids are not purely elastic and the energy required to make a crack grow involves much more than just the chemical surface energy. In fact, the energy dissipated by other means often dominates the process and may be several orders of magnitude higher than the chemical surface energy term. As explained in modern texts on fracture mechanics, this has not prevented the use of fracture mechanics for analysis of fracture in other quasi-elastic systems, where typically the other dissipation mechanisms are lumped into the fracture energy term Gc (discussed later). Techniques are also being developed to use the basic approach for systems that experience extensive viscoelastic and plastic deformation. These approaches are more complex. Here we confine our attention to quasi-elastic cases. Significant research and development work has gone into methods of increasing the dissipative processes required for a crack to grow, thereby, ‘‘toughening’’ the materials. As a consequence, another name for the fracture energy is fracture toughness Gc.
While Griffith’s earlier fracture mechanics work was for cohesive fracture, the extension to adhesive systems is logical and straightforward. In the latter case, one must account for the strain energy in the various parts of the system, including adherends and adhesive, as well as recognizing that failure can proceed through the adhesive, the adherend, or the interphase region between them. Here too, energy methods can be useful in determining where the crack might grow since one might anticipate that it would use the path requiring the least energy.
In principle, the fracture mechanics approach is straightforward. First, one makes a stress-strain analysis, including calculation of the strain energy for the system with the assumed initial crack and the applied loads. Next, one performs an energy balance as the crack proceeds to grow in size. If the energy released from the stress field plus the work of external forces is equal to that required to create the new surface, the crack grows. A difficulty in performing these analyses is that for many practical systems, the stress state is very complex and often not amenable to analytical solutions. With the use of modern computers and computational codes, this is becoming progressively less of a problem. Finite element codes are refined to the point that very accurate stress-strain results can be obtained, even for very complex geometries (such as adhesive joints). Furthermore, it is possible to incorporate complex material behavior into the codes. The latter capability has not reached its full potential to date, at least in part, because the large strain deformation properties of the materials involved, at the crack tip, are not well defined.
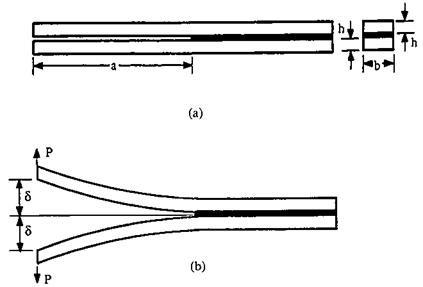
A relatively simple example may help in understanding the application of fracture mechanics. First, let’s assume that we have two beams bonded together over part of their length, as shown in Fig. 10a. Here we will make two additional convenient (but not essential) assumptions: (1) the adhesive bond line is sufficiently thin that when bonded as shown in Fig. 10b, the energy stored in the adhesive is negligible compared to that in the unbonded length of the beams a; and (2) the length a is sufficiently long that when loaded, the energy due to bending dominates (i. e., the shear energy and other energy stored in the part of the beam to the right of a is negligible).
|
Figure 10 Double cantilever beam specimen showing nomenclature and specimen deflection. |
The end deflection of the unbonded segment of each beam due to a load P is found in mechanics of material texts to be [40]
|
Pa3 3EI |
„3
![]() (1)
(1)
where a is the unbonded length, E the modulus of elasticity for the material from which the beams are manufactured, and I the moment of inertia for a rectangular cross-section. The work done by the forces P in deforming this double cantilever is therefore
|
P2a3 3EI |
![]()
 |
|
W = 2p(28)
If we assume Griffith-type fracture behavior, the energy released as the crack grows (a increases) must go into the formation of new fracture surface. The fracture energy Gc (sometimes called energy release rate) is therefore
|
9U 19U P2a2 12PV 9A = b ~da = ~EIb = Eh3 b2 |
Substituting Eq. (3) into (4) and taking the limit leads to
where
9A « 2a(b) (6)
We thus see that such beam systems could be used to determine Gc. Indeed, ASTM D-3433 makes use of such beams for this measurement. It should be noted that the equation given in Section 11.1.1 of D-3433 has a similar form:
This equation can be used for smaller values of a since it includes effects of shear and other factors that, as noted above, were neglected in our simple analysis. Inspection of Eq. (7) shows that as a becomes large compared to h, this equation reduces to that derived above. By tapering the beams, ASTM shows how a related geometry can be used for Gc determination where the data analysis is independent of the crack length. The advantage here is that one need not monitor crack length. An advantage of double cantilever beam specimens is that measurement can be made for several different values of a for a given beam, making it possible to get several data points from a single sample. Conversely, if Gc is known, say from another test configuration, fracture mechanics can be used to determine the load required to initiate fracture.
The case described above is the exception rather than the rule. Most practical problems do not have stress and displacement fields easily obtained by analytical methods. Numerical methods can be applied to obtain the necessary stress and displacements needed to calculate the energy release rates. The basic consideration for calculating energy release rates is accounting for the difference in energy before and after crack extension dA. This condition can be approximated for a discrete system by using finite
element methods (FEMs), that is, by using a computer to calculate the strain energy change as a crack area is incrementally increased.
Two different methods of calculating the energy release rate numerically are outlined briefly. The first, the compliance method, is readily applied using FEM [37]. This method requires only two computer runs for each energy release rate desired. The first computer run is used to calculate the total relative displacement, ua, of the sample for the crack length a, under a constant force Fa. In the second computer run, a finite element node is released, extending the crack to a length of a + Да. The second run allows calculation of the total relative displacement, ua+^, of the sample for a crack length a + Дa under the same constant load Fa. Using the discrete form of the energy release rate for a linear elastic body leads to
Г7 a/ a-ЬДa a
![]() F (u — u )
F (u — u )
G =—— 2Дa——
 |
|
The discrete form of the energy release rate under constant displacement assumptions for the same crack length can easily be shown to be
A third computer run can be used to extend the crack by releasing the next node in front of the crack tip. This increases the crack length to a + 2Да. Letting ua+^ equal the new relative displacement and ua equal the total relative displacement from run 2, the energy release rate for the new crack length can be computed using Eq. (8) or (9) with the addition of only one computer run. This process can be repeated, each time determining a new energy release rate per single computer run, thereby producing a curve of energy release rate versus crack length. The crack length for which the energy release rate is equal to Gc is a critical crack length where failure should ensue.
A second method for calculating energy release rate is the crack closure integral (CCI) method [37,41-43]. This method uses FEM techniques to calculate the energy that is needed to close a crack extension. It is assumed that for an elastic system this energy is equivalent to the energy that is needed to create the crack’s new surface, giving an alternative method of calculating the energy release rate from that just discussed.
The CCI method is also readily accomplished using FEM. The energy release rate calculated as outlined in the following is for a constant stress crack extension assumption. In general, this method requires four computer runs for each energy release rate calculated. The method can be shortened to three computer runs if verifying that the crack was closed is not necessary. In this case, only the second, third, and fourth steps explained below need to be performed.
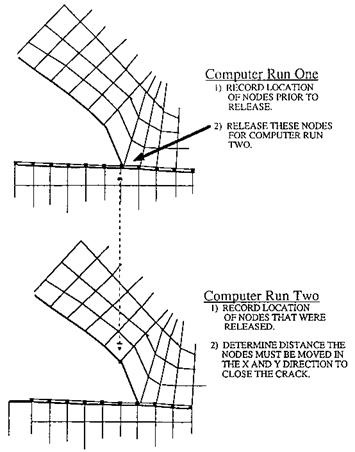
The first computer run is used to calculate the displacements (or locations) of the finite element nodes near the crack tip for crack length a under constant load Fa. Let uBX1 and uBY1 represent the displacements of the first bottom node in the X and Y directions, respectively, from run 1. Let uTX1 and uTY1 represent the displacements of the first top node in the X and Ydirections, respectively, from run 1. Since we have not yet released this first node for run 1, the top and bottom nodes are coincidental and should have the same displacement. This initial displacement indicates the point to which the nodes will have to be moved when the crack is closed in runs 3 and 4.
In the second computer run, a node is released extending the crack length to a length of a + Да. This allows calculation of the new nodal positions of the same nodes that were
|
Figure 11 Pictorial of the first and second steps in the CCI method of determining energy release rates. |
released from run 1 while under the constant load Fa. Let uBX2 and uBY2 represent the displacements of the bottom node in the X and Y directions, respectively, from run 2. Let uTX2 and uTY2 represent the displacements of the top node in the X and Y directions, respectively, from run 2. The distance between the top node and bottom node in the X and
Y directions indicates how far the nodes will need to be moved in each direction to close the crack. Figure 11 shows computer runs 1 and 2 in a pictorial schematic and summary of the two steps.
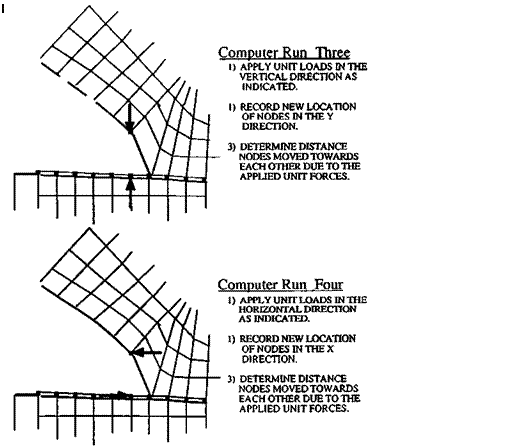
In the third run, vertical unit forces are applied to the released nodes in the direction needed to bring them back to their original vertical positions. The nodal displacements of these released nodes of the sample for a crack length of a + A a under the same constant load Fa are noted. Let uBY3 represent the displacement of the bottom node in the
Y direction from run 3. Let uTY3 represent the displacements of the top node in the
Y direction from run 3. The difference between the node displacements from runs 2 and 3 indicates how far the vertical unit force moved each node toward its original position.
The fourth run is the same as run 3 except that the forces are now horizontal. Figure 12 shows computer runs 3 and 4 in a pictorial schematic and a summary of the two steps.
Runs 3 and 4 provide a measure of how much each node is moved back toward each original position by unit forces. Since the material is modeled as linear elastic, the force required to move each node back to its original position can be determined simply by increasing these forces in proportion to the total displacements required to bring the nodes back to their original position. We will call these forces FX and FY. The energies EX and EY required to close the crack in the X and Y directions can now be calculated by determining the work of these forces on the crack closure displacements since for an elastic system, the work is stored as strain energy.
Based on this analysis, the energy release rates can be partitioned into the energy release rates associated with crack opening displacement (GI) and shear displacement normal to the crack surface (GII):
![]()
 |
AEf — A EX
AA
AEf — AE2y
AA
The total energy release rate can be determined from
G = Gi + Gii (11)
In Eqs. (10) and (11), G represents the total energy release rate under constant-stress crack extension assumptions, GI represents the portion of G in the mode I direction, and GII represents the portion of G in the mode II direction. A couple of concluding comments to this section might be in order. Each of these methods of solving for the fracture energy has advantages. The compliance method is simpler and less expensive to perform. The crack closure method, on the other hand, facilitates calculation of crack growth analysis under different loading (i. e., crack opening or shear). There is evidence that cracks in materials behave differently under the various loadings. As a consequence, growth of a given crack may depend on the relative amounts of mode I and mode II stresses at its tip. It is also advantageous to have the two methods of determining G. Since they provide a systematic check on each other, that might be used to verify for code, programming, or other errors.
Computer-based energy release rates might be a very useful design tool. An example might be used to illustrate such use. Assume that nondestructive evaluation techniques are used to locate and determine the size and shape of a debond region in the interphase region of an adhesive bond in a structure. An example of such a bond might be between a rocket motor case and a solid propellant grain. A reasonable question would be: Is this ‘‘flawed’’ region ‘‘critical’’ in that it might cause failure under prescribed service load conditions? For many structures (e. g., the rocket case noted) this might literally be a million dollar question. A reliable answer could mean the difference between safely using the structure or needing to repair or discard it. Trying to answer the question experimentally would generally be very expensive. An alternative approach might make use of fracture mechanics. One might use FEM to model the structure, including the debond region that has been identified. Using the techniques outlined above, the energy release rate can be calculated for assumed increases in the size of debond. If the critical fracture toughness (Gc) is known (perhaps determined from independent tests with standard specimens), it can be compared with the value calculated. If the energy release rate calculated for the debond in the structure is equal to Gc, the debond is apt to grow. If it is larger than Gc, the crack should accelerate. Values of energy release rate significantly lower than Gc would indicate a noncritical region. Other types of irregularities, cohesive or adhesive, might be treated in a similar manner. Obviously, such an approach requires not only adequate FEM techniques and computers but also nondestructive means to identify and quantitatively measure potential critical regions.
As a final note in this section, a few examples taken from the research of the authors and their associates, on the utility of fracture mechanics in conjunction with numerical analysis, might be informative. Some of the research in the authors’ laboratory has centered on identifying the loci of failure “initiation” and the paths followed by cracks as they proceed through the adhesive in a joint.
Several rather different geometries have been investigated, some that were patterned after standared test configurations and one designed to simulate a specific application. The latter was a cone pull-out (or twist-out) specimen devised to simulate such dental adhesive applications as fillings, caps, and crowns [42,44]. In this test configuration material in the form of a truncated cone was bonded into a matching hole in a plate. Pulling (or twisting) could initiate failure of the cone while the plate was held fixed. If the cone had a zero degree cone angle, the test became a cylinder pull-out test. For the tests of interest here, the cone and the plate were fabricated from transparent poly(methyl methacrylate) (PMMA) and the adhesive was transparent polyurethane (Thiokol Solithane-113). The use of these materials allowed visual observation of the bond line of the adhesive joint. The lower 1.6 mm (at the truncated cone end) was left unbonded to act as a starter crack. Finite element analysis of this specimen, under stress, indicated that as the tip of this region was approached the stresses induced in the adhesive became very large (singular). Somewhat removed from this point, the stresses were finite and well behaved, independent of cone angle.
When samples with a zero degree cone angle were pulled to failure, it was always observed that the failure propagated from this starter crack. On the other hand, when the cone angle was increased slightly (e. g., to 5°), the initial failure was never observed to originate at this starter crack. Rather, the first signs of failure were observed further up in the joint—approximately halfway between the end of the starter crack and the other end of the bond line. This crack then grew from that point until ultimate separation occurred. The obvious question was, why did failure not occur at the point of ‘‘maximum stress,’’ i. e., at the starter crack? The numerical analysis did indicate that there was a local maximum in the stress at the point where failure was first observed but the value of this maximum was significantly lower than that close to the singularity point. We feel the answer lies in the difference in the nature of the energy release rate (ERR or G) at the two points. A small (25 mm) ‘‘inherent’’ cracklike flaw was assumed to exist at the local ‘‘stress maximum’’ referred to above. The ERR was calculated for a crack proceeding from this point and compared with the value of the ERR for a crack emanating from the much larger starter crack. Even for such a small assumed inherent crack, the calculated ERR was larger at the point halfway up on the specimen. The conclusion was that failure is governed by the ERR and that failure initiation is at points of maximum ERR.
This same conclusion was substantiated by a series of tensile tests in which a butt tensile joint specimen was formed by adhesively bonding a PMMA rod to a PMMA plate with the polyurethane referred to above [42,44]. The specimens were set up in an Instron testing machine adapted with holes and a mirror arrangement that allowed the bond line to be observed and recorded with a video recorder. Finite element analysis indicated that for small assumed cracklike flaws, the values of the ERR and the location of maximum ERR were very strong functions of the ratio of the adhesive thickness to the joint diameter. As a consequence, the load required to propagate a crack should be a function of the thickness of polyurethane, even for constant size initial cracks. Furthermore, since the location of maximum ERR varied with this same thickness, one would anticipate the location of crack growth initiation to vary. Experimentally, both features were observed: (1) Variation in the value of the load required to propagate a crack was completely consistent with the calculated variation in ERR with thickness. (2) When the ERR for the assumed 25 mm inherent flaw was largest at the edge, cracks tended to start at the edge. When the ERR was greater in the center, that was the location from which the crack was observed to emanate. It is noted that, as with the cone test, finite element analysis indicated that the stresses at the bond line become singular as the outer diameter of the specimen is approached (e. g., as r! R0).
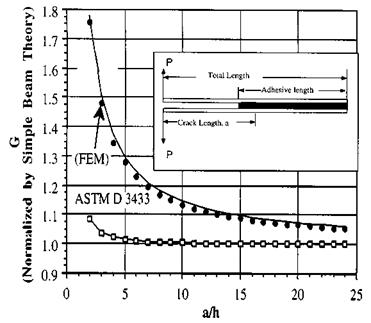
The final example involves fracture mechanics-finite element analysis of the double cantilever beam (nontapered) specimen (see Fig. 10 as well as the figures and descriptions in ASTM D-3433). The finite element analysis was very much as outlined above, leading to Eqs. (8) through (11). These results were compared with the equations in Section 11.1.1 of D-3433 (Eq. (7) in this chapter). Except for the longest cracks (i. e., very large a in Fig. 10), the FEM-determined ERR differed appreciably from the Gc value determined from Eq.
(7) . These differences might be attributed to the fact that the derivation of Eq. (7), similar to that for Eq. (5), assumes ideal cantilever boundary conditions at the point x = a.
|
Figure 13 Comparison of the ERR determined by FEM with G values calculated using the equations from ASTM D-3433 as a function of the ratio of crack length, a, to couble Cantilever beam specimen depth, h. |
The assumed conditions are that there is no deflection and zero slope (i. e., no rotation) at that point. Figure 13 (taken from [45]) illustrates that the differences in G, determined by the two methods, might be 50% or more for small values of a. The experiments described in ref. [45] demonstrate that much more consistent values of Gc are obtained when using the FEM to calculate Gc, from the experimental results over typical a/h values, than when they are calculated using the equation from D-3433. In the FEM case, the variation was typically less than ± 5%, while the variation using Eq. (7) could be ten times larger.
In addition to ignoring the energy associated with the nonideal cantilever conditions just described, the derivation of Eqs. (5) and (7) also neglects any energy stored in the adhesive. While this latter assumption might be valid for extremely thin adhesives, it is noted that for many adhesive-substrate combinations the modulus of the adhesive is only a few percent that of the adherends. As a result, for adhesives with thicknesses that are 5%, or so, of the adherend’s thickness the contribution of the strain energy in the adhesive to the ERR (Gc) can be appreciable. This is also consistent with the experimental observations reported in ref. [44]. Inclusion of the strain energy in the adhesive in the total energy balance facilitated an additional calculation/observation. Adhesive engineers and scientists have long speculated on reasons for the common observation that cracks in adhesive joint generally follow paths somewhat removed from the so-called adhesive-adherend ‘‘interface’’ rather than along this bond line. It might reasonably be assumed that cracks would follow paths of maximum energy release rate, since this would be the path where the most energy would be dissipated. In the FEM analysis, various crack paths were assumed through the adhesive and the ERR determined [45]. By varying the adhesive and adherend(s) thicknesses, it was possible to design double cantilever beam specimens in which the path of Max-ERR was near the center of the adhesive, near one or other of the
|
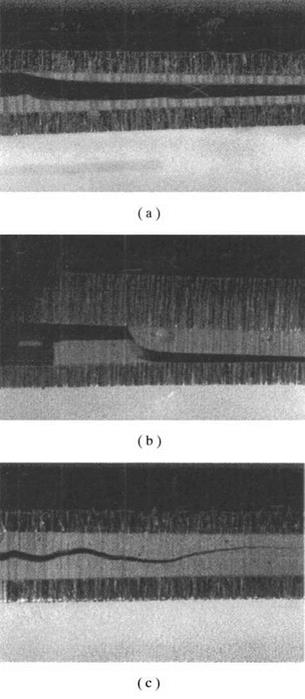
edges of the adhesive, or relatively constant across the thickness. Samples of these differing geometries were constructed of aluminum and an adhesive (both of which exhibited relatively linear elastic behavior) to simulate the linear elastic finite element calculations. Starter cracks were introduced at different locations through the adhesive thickness. These samples were pulled to failure, the fracture load recorded, and the locus of the fracture path observed/noted. In every case, the experimentally observed fracture paths closely followed the planes of Max-ERR determined by the finite element analyses. If the starter crack was somewhat removed from this location, the ‘‘running’’ crack quickly moved to the path of Max-ERR. Figure 14 [45] shows photographs of some samples from these experiments. Photograph (a) was for a sample in which the FEM-determined ERR was maximum at the center and the starter crack was at the edge. The crack started at the starter crack and then moved to and ran nearly planar along the center. Photograph (b) is for a sample with different thicknesses of adherends. Here the FEM-determined ERR was at the lower edge of the adhesive and the starter crack was introduced at the upper edge. The crack started at the starter crack but again quickly moved to and ran along the path of Max-ERR. In (c) the FEM-determined ERR was relatively insensitive to the exact path in the adhesive. Here, there was no ‘‘mechanical’’ reason for a preference for a specific path and the crack wandered as apparently chemical or physical differences in the adhesive dictated the exact path followed.
These analyses and associated experiments demonstrate that fracture mechanics can be used to provide information and insight into the value of the failure load, the locus of likely crack growth, and the path along which the crack will then grow. Where analytical analyses of stress, strain, and energy release rates are difficult or impossible, modern numerical methods can be very useful. In the opinion of the authors, the utility of these combined tools has hardly been exploited. The inclusion of nonlinear, nonelastic effects in the analyses is feasible is such materials are carefully characterized and/or properties become available.
There are a great many properties that affect adhesive quality. One of the more important is the strength of joints formed with the adhesive and adherends. We have discussed a number of standard tests commonly used to ‘‘measure’’ adhesive joint strength. These methods are valuable and serve many purposes. In this chapter, however, we point out that the use of the ‘‘standard’’ results from these tests to predict the strength of other joints that differ in even seemingly minor details is questionable. A more reliable comparison between adhesives and joints might be to compare more fundamental properties, such as moduli, adhesive fracture toughness, and so on. This is a basic premise of fracture mechanics. With improved computation facilities and codes, these methods show promise for using results from standard tests to predict the performance of other (perhaps more complex) practical adhesive joints. As such, they should become very powerful design tools.
 6 июля, 2015
  Malyar
 Опубликовано в рубрике