As mentioned earlier, the DMTA technique measures molecular motion in adhesives, and not heat changes as with DSC. Many adhesives exhibit time-dependent, reversible viscoelastic properties in deformation. Hence a viscoelactic material can be characterized by measuring its elastic modulus as a function of temperature. The modulus depends both on the method and the time of measurement. Dynamic mechanical tests are characterized by application of a small stress in a time-varying periodic or sinusoidal fashion. For viscoelastic materials when a sinusoidal deformation is applied, the stress is not in phase with displacement. A complex tensile modulus (E*) or shear modulus (G*) can be obtained:
E * = E’ + iE00 (or G* = G’ + iG») (20)
where E’ (or G’) is the in-phase component (or real or storage part of dynamic modulus) and E00 (or G») is the out-of-phase component (or imaginary or loss part of dynamic modulus). The mechanical loss factor corresponding to the damping of the material can be defined by tan 8. The significance of viscous dissipation in a material is described by tan 8 and is often the parameter chosen to relate dynamic data to molecular or structural
|
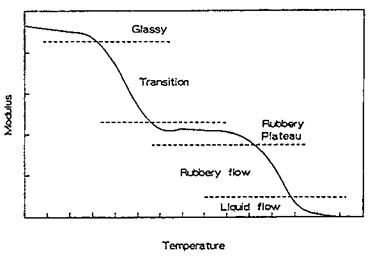
Figure 24 Typical modulus-temperature curve for an amorphous adhesive. |
motion in plastics materials. The dynamic modulus for polymers is strongly dependent on temperature and frequency in the transition zones:
tan 8 = E/E’ (orG/G’) (21)
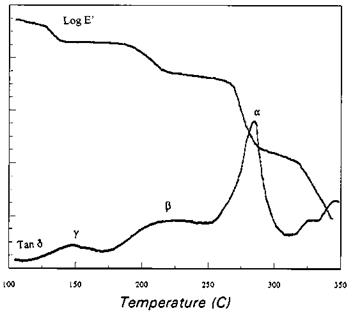
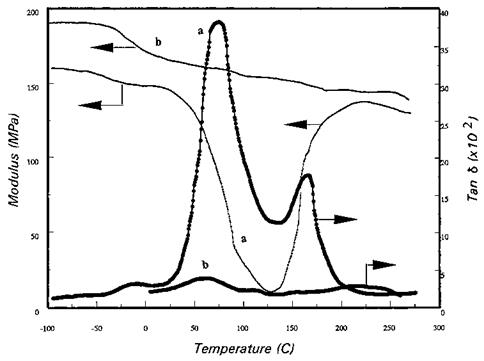
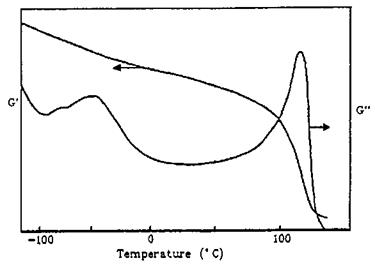
It is interesting to study E’ (or G’) and tan 8 by changing frequency at constant temperature and changing temperature at constant frequency. Dynamic mechanical spectroscopy by studying E* (or G*) versus temperature and frequency can give information about relaxation processes (i. e., main chain relaxation from glass to rubber associated with the glass transition process and secondary transitions related to movements of side chains or to motions of small parts of the main chain). The elastic modulus-temperature curve for a typical amophous polymer is given in Fig. 24 and shows five different regions: (1) the glassy region where the modulus of most amorphous polymers is of the order of 1011 dyn/cm2; (2) the transition region, where the modulus changes rapidly with temperature; (3) the rubbery plateau region, which is apparent only when polymers form a loose network by cross-linking or by pigment reinforcement; (4) the rubbery flow region; and (5) the liquid flow region. The modulus in these various regions of viscoelastic behavior is affected differently when the molecular weight of the polymer is changed. Figure 25 illustrates the main features observed during a DMTA scan of a semicrystalline polymer. Relaxation in the amophous phase is labeled with Greek letters (a, p, g) with decreasing temperature. For adhesive applications, the curing of adhesives is particularly suited to DMTA-type studies, because it is the mechanical properties that are vitally important during production and in final use. During the cure process, the modulus increases with cure. The tan 8 value usually rises at first, then falls rapidly as the cross-link density becomes higher and progressively inhibits conformation changes. The changes in E 0 and tan 8 of a phenolic adhesive are shown in Fig. 26. It is apparent the uncured specimen shows a large damping peak at Tg and a smaller damping peak associated with cure. Dynamic mechanical properties of epoxy resins cured with various kinds of hardeners have been evaluated by Kamon and Furukawa [67]. The data in Fig. 27 show Tg relaxation spectra in a carbon fiber-reinforced epoxy resin; the position and area of the loss peaks in
|
Figure 25 Typical transition behavior in mechanical storage modulus and damping for a semicrystalline polymer. Relaxations in the amorphous phase are labeled with Greek letters (a, b, g) with decreasing temperature. |
|
Figure 26 Shear storage modulus (thin lines) and damping (thick lines) for an uncured (a) and cured phenolic adhesive (b). |
|
Figure 27 Shear storage modulus, G’, and damping, G", as a function of temperature for a carbon fiber-reinforced epoxy adhesive cured at 120°C. |
the composites indicate the degree and direction of reinforcement, in addition to the degree of cure in the matrix of the polymer.
The example cited in this chapter clearly establish that physical analysis techniques, such as GPC, FTIR and Raman spectroscopy, NMR, DSC, thermogravimetric analysis (TGA), and DMTA, are broadly applicable in adhesive research, product development, manufacturing, and quality control or assurance programs. Unfortunately, space constraints have prevented detailed discussions of array of techniques that further enhance the utility of all the physical analysis techniques that were introduced here. Discussion of these can be found in many of the references cited in this chapter.
It has become apparent that, in most instances, no single technique will be available to give totally unambiguous information. Thus, it is frequently desirable to use several different techniques to study a specific adhesive to obtain detailed information for a particular property. The more techniques to which a problem can be exposed, the greater the chance of a solution. In some cases it may be necessary to conduct analysis or characterization with two or more techniques simultaneously.
 10 июля, 2015
  Malyar
 Опубликовано в рубрике