There are three accepted methods of determining yS values at infinite dilution and which were published by Dorris and Gray [98], Schultz et al. [95] and Donnet et al. [99].
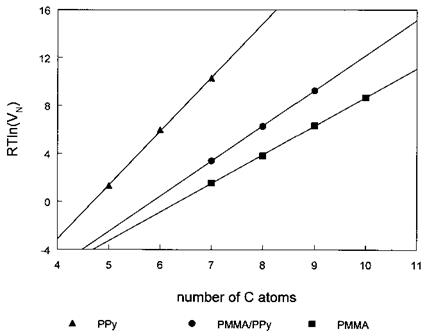
a. The Method of Dorris and Gray. This method [98] is based on the determination of AGCH2, the free energy of adsorption per methylene group, from the retention data of the n-alkane series (probes capable of dispersive interactions only). Figure 7 depicts plots AGa or RT ln(VN) values versus the number of carbon atoms in the n-alkanes (nC) for PPyCl, PMMA, and a PMMA-coated PPy (the PMMA/PPy sample was prepared by adsorption of PMMA onto PPy from chloroform). Each plot generates an excellent linear correlation, the slope of which equals AG™2. For a solid-CH2 interaction, Eq. (9) can be rewritten as
W = W d= 2(y Sy CH2 )1/2 (28)
where yCH is the surface free energy of the methylene group, taken as the y values for polyethylene since this polymer contains only methylene groups. Given that W is a free
|
Figure 7 RT ln(VN) versus the number of carbon atoms for n-alkanes adsorbed (at 48°C) onto PPyCl, PMMA, and PMMA-coated PPyCl prepared in chloroform (PMMA/PPy). The slopes yield yd values of 145, 36.6, and 55mJ/m2 for PPyCl, PMMA, and PMMA-coated PPyCl, respectively. The intermediate value obtained for PMMA/PPy is an indication of a patchy adsorbed layer of PMMA on the PPy surface. |
energy change per unit area, it follows that
where N is the Avogadro number and, aCH, is the cross-sectional area of an adsorbed methylene (CH2) group (6 A2). Combining Eqs. (28) and (29) one can determine yS using
|
|
|
|
|
|
![]()
where yCh is temperature dependent and yCHl(mJ/m2) = 36.8 — 0.058 T(°C) [98]. The validity of this approach has been established on the basis that IGC and wettability measurements led to approximately the same yS value (ca. 40mJ/m2) for poly(ethylene terephthalate) [100].
b. The Method of Schultz et al. This approach [95] relates the retention data to the cross-sectional area and the dispersive contribution to the surface tension (yL) of the molecular probes. For probes interacting with the solid of interest via dispersive forces only (e. g., linear, branched, or cyclic alkanes), a combination of Eqs. (9), (27), and (29) leads to
RT ln (VN) = 2Na(ySyL)1/2 + C (31)
where a is the area of an adsorbed probe molecule and C is a constant (all other variables were defined above). The method leads to values comparable to those obtained by Gray’s approach at low temperature (error less than 4%), but significantly deviates at higher temperature (100°C) [17]. Hamieh and Schultz [101] proposed a temperature dependence of the cross-sectional area of the probe molecules to improve this approach. However, the refinements suggested in [101] to calculate ySd values for a series of metal oxides were overshadowed by the poor reproducibility of the measurements [102].
c. The Method of Donnet et al. Donnet et al. [99] proposed to rewrite Eq. (27) in the form
RT ln Vn + C = K(hvs)1/2«cs(hvL)1/2«0L (32)
where hvS and hvL are the ionization potentials of the interacting materials, a0 is the deformation polarizability, and K is a constant which takes into account the vacuum permittivity, the distance between interacting molecules, and the Avogadro constant. S and L refer to solid and liquid, respectively. K(hvS)1/2a0S is a characteristic of the solid under investigation and is related to ydS.
Table 8 provides ydS values for some polymers, fillers, and fibers over a wide range of temperature, which constitutes an advantage over contact angle measurements. There are four important points which must be borne in mind concerning the IGC determination of y^ values.
(i) For heterogeneous high energy surfaces characterized by IGC at infinite dilution, solutes will preferentially probe the high energy sites and the technique will thus lead to ydS values higher than those obtained by contact angle measurements [17,112,117]. For example, y^ values determined for conducting polymers by IGC were found to be always higher than those estimated by
|
|||
|
|
||
 103
103
104
105
103 106 106 105 100
96
107
107
118
104
109 104
104 41
105 105
110
111
111
103
99
112
112
113
113
113 103
114
111 92
115
112 116 116 103 103 103 103 107 107
94
(continued )
|
Materials |
yS (mJ/m2) |
Temperature (°C) |
Ref. |
|
Yellow |
34.4 |
50 |
94 |
|
Rutile |
23.2-25.6 |
60 |
94 |
|
Monastral green |
43.0 |
60 |
94 |
|
LLDPE, low density polyethylene; PTEDM, poly(2,2′-thiobisethanol dimethacrylate); PNDM, poly(N-methyl — diethanolamine dimethacrylate); PPDM, poly(pentane-1,5-diol dimethacrylate); PET, polyethylene terephthalate; PEEK, poly(ether ether ketone); Luxtrak™, ultraviolet-methacrylate resin (470 nm); PPyCl, chloride-doped polypyrrole; PPyTS, tosylate-doped polypyrrole; PPyNO3, nitrate-doped polypyrrole; PPyNO3/PVC/PMMA, PPyNO3 powder coated with blends of PVC and PMMA cast from THF or dioxane; PANI, polyaniline; C(PAN); poly(acrylonitrile)-based C fiber characterized before and following electrochemical oxidation; E-glass/GPS, E-glass fiber treated with y-glycidoxypropyltrimethoxysilane; E-glass/APS, E-glass fiber treated with aminopropyltriethoxysilane (APS); Al2O3-w-GPS93, hydrated alumina powder treated with GPS and cured at 93°C. TiO2/gas plasma is rutile treated with either CH4, C2F4, or NH3 plasma; PPyCl/PMMA/ CHCl3, PMMA-coated PPyCl in CHCl3; PPyCl/PMMA/dioxane, PMMA-coated PPyCl in dioxane; Shieldex AC3 (pigment) is a calcium ion-exchanged amorphous silica; K-White is an aluminum triphosphate pigment; Monastral green is a phthalocyanine type of organic pigment. |
wettability [66,118] (compare the values reported in Tables 7 and 8 for PPyCl and PPyTS).
(ii) The values reported for example for Al2O3 strongly depend on the nature and the concentration of metal oxide impurities such as silica which are likely to segregate to the surface and thus affect the surface energy [115]. Papirer et al. [89] have shown that the impurities significantly modify the acid-base properties of fillers such as alumina and thus considerably affect their adsorptive capacities towards polymers (see Acid-Base section, IV. B.2).
(iii) IGC yields very high values of y^ for microporous and lamellar materials by comparison to the reference amorphous values [90]. Table 8 reports an extremely high yS value of 225 mJ/m2 for the polypyrrole-silica nanocomposite at 60°C which is much higher than those of the reference silica sol and bulk polypyrrole powder (60 and 145 mJ/m2, respectively). The apparent high surface energy of the nanocomposite [111] was interpreted in terms of the microporosity of these ‘‘raspberry-structured’’ colloidal materials [119].
(iv) The ySd (and also acid-base descriptors) strongly depend on the conditioning temperature especially in the case of hydrated materials such as silica [120] and calcium carbonate [114].
 24 июня, 2015
  Malyar
 Опубликовано в рубрике