1. Determination of the Surface Tension Components
The wetting of a solid surface by a liquid drop is expressed by Young’s equation
Ys — Ysl= УLcos в (18)
Combining this equation with Eq. (8) one obtains the Young-Dupre equation for the work of adhesion
Wa = Yl(1 + cos в) (19)
Combining and rearranging Eqs. (19), (9), and (16) one obtains
yL(1 + cos в) = 2(ySуL^2+2(yS У-^2+2(y- У^ (20)
Using at least three of the test liquids indicated in Table 6 one can determine the surface tension components у ]J, yL, and у — for the surface under test and hence the total surface free energy
ys= yS+2(ys y-)1/2= y S+ySB (21)
where y^8 is the overall acid-base contribution to уS. The problem can be solved in two steps. First, yS can be determined using an apolar liquid (e. g., diiodomethane or a-bromonaphthalene) for which yL = yL. In this case, Eq. (20) reduces to
Yl(1 L cos в) = 2(ydyL)1/2 (22)
where в is the measurable value and ylJ is the only unknown. Two unknowns are yet to be determined for the solid material following rearrangement of Eq. (20):
yL(1 + cos в) — 2(ySyL^2 = 2(ySy-^2+2(y — yL)1/2 (23)
To do so, one can use water and another test liquid of which уL and/or y— are greater than 0 mJ/m2. However, it must be borne in mind that the unknowns are (ys)1/2 and (y-)1/2 and must thus have values greater than or equal to 0mJ/m2.
Table 7 reports the surface free energy values and their dispersive, acidic, and basic components for polymers and other materials. There are some interesting features about the yL (acidity) and the у- (basicity) scales reported in this table:
Receding contact angles show that the ‘‘real’’ PE surface is bifunctional with a significant basic character. This is most probably due to the low level of surface oxidation of the polymer [74].
PEO is a fairly basic polymer and this character is stronger than in the case of methacrylate polymers.
PS has a low degree of basicity as expected from its chemical structure.
Plasma-treated PP and OPP have comparable basicities, but the acidic character is stronger for the latter as a result of air plasma treatment.
All metal oxides and glass have strong basic character, but the least strong is silica. In contrast, silica behaves as a strong acidic oxide, which parallels the IEPS scale.
Acid-treated glass is much more acidic than APS-treated glass. The latter exhibits a very strong basic character due to the amino groups at the outermost layers. Glass-C18, has a low у value, almost reducing to its ylJ, the acid-base character being very weak. This is most probably due to a quasi-total screening of the substrate by the hydrophobic octadecylsilane coupling agent.
|
Table 7 Surface Free Energy Components (in mJ/m2) for Polymers, Fibres, Metal Oxides, Glass, Microorganisms and Proteins
(continued ) |
|
у |
уd |
AB у |
у+ |
у |
Ref. |
|
|
Silicon wafer |
61.9 |
38.6 |
23.3 |
4.00 |
33.98 |
70 |
|
Glass |
59.3 |
42.03 |
17.80 |
1.97 |
40.22 |
70 |
|
Glass, H2SO4/HNO3 |
64.5 |
42.03 |
22.47 |
2.82 |
44.76 |
70 |
|
Glass, C18 |
26.8 |
25.70 |
1.12 |
0.24 |
1.32 |
70 |
|
Glass, APS-treated |
45.0 |
39.2 |
5.76 |
0.084 |
98.62 |
This work |
|
Microorganisms and biological materials |
||||||
|
HSA, dry, pH 4.8 |
45 |
44.0 |
0.10 |
0.03 |
7.6 |
71 |
|
HSA, dry, pH 7 |
41.4 |
41.0 |
0.4 |
0.002 |
20 |
71 |
|
HSA, hydrated, pH 7 |
62.5 |
26.8 |
35.7 |
6.3 |
50.6 |
71 |
|
HIg-G, hydrated, pH 7 |
51.3 |
34 |
17.3 |
1.5 |
49.6 |
71 |
|
HIg-A, hydrated, pH 7 |
26.8 |
26.8 |
0 |
0 |
93.0 |
71 |
|
Bovine fibrinogen, dry |
40.3 |
40.3 |
0 |
0 |
53.2 |
71 |
|
Human fibrinogen, dry |
40.6 |
40.6 |
0 |
0 |
54.9 |
71 |
|
HLDLP, dry |
41.1 |
35.5 |
5.66 |
0.26 |
30.8 |
71 |
|
Candida albicans (yeast)f |
42.5 |
38.1 |
4.4 |
2.9 |
1.7 |
72 |
|
Candida albicans (yeast)8 |
47.7 |
37.3 |
10.4 |
0.6 |
43.7 |
72 |
|
Streptococcus gordonii (bacteria)g |
38.9 |
35.8 |
3.1 |
4.2 |
0.6 |
72 |
|
Streptococcus oralis 34 |
57.0 |
35.0 |
22.0 |
2.7 |
45.0 |
73 |
|
Streptococcus oralis J22 |
48.7 |
38.0 |
10.68 |
0.5 |
57.0 |
73 |
|
Actinomyces naeslundii 5951 |
44.0 |
38.0 |
6 |
0.5 |
18.0 |
73 |
|
Actinomyces naeslundii 5519 |
40.0 |
37.0 |
2.97 |
0.1 |
22.0 |
73 |
|
Miscellaneous |
||||||
|
PSA |
16.7 |
12.6 |
4.1 |
0.42 |
9.9 |
62 |
|
Cellulose acetate |
40.2 |
35 |
5.2 |
0.3 |
22.7 |
10 |
|
Cellulose nitrate |
45 |
45 |
0 |
0 |
16 |
10 |
|
Agarose |
44.1 |
41 |
3.1 |
0.1 |
24 |
10 |
|
Gelatin |
38 |
38 |
0 |
0 |
19 |
10 |
|
aBased on advancing contact angles; bbased on receding contact angles; “surface energy components increasing with AuCl§ doping; dusing water/ethylene glycol; “using water/formamide; fcultured at 30°C; gcultured at 37°C. PVAc, poly(vinyl acetate); PVC, poly(vinyl chloride); PS, polystyrene; PE, polyethylene; PAI, iodinated polyacetylene; PHEMA, poly(2-hydroxyethyl methacrylate); P(HEMA/EMA), radiation-grafted poly(2-hydroxyethyl methacrylate-co-ethyl methacrylate)—the numbers refer to each monomer content; PPyDS, dodecyl sulfate — doped polypyrrole; POT, poly(octyl thiophene); PP, polypropylene; OPP, oriented polypropylene; Ultem®, poly — etherimide; PU, polyurethane; HSA, human serum albumin; HIg-A and — G, human immunoglobulin A and G; HLDLP, human low density lipoprotein; PSA, pressure sensitive adhesive; —Scotch 610 Magic Tape®. |
Despite these interesting trends, the vOCG method has been criticized for the following reasons:
(i) the results depend on the choice of the wetting liquids
(ii) almost all surfaces have у§ values much higher than those of y+
(iii) all surface free energy components were determined on the assumption that y+ = y~ = 25.5 mJ/m2 for water whereas water is a stronger Lewis acid than a Lewis base [75,76].
Criticism (i) is totally unfair, because statistically one cannot determine у § and у § with a set of only three test liquids of known surface tension components because a great extent of scatter in the results is to be expected. In the literature, sets of у + and у § are

![]()
![]()
reported for each set of two liquids wetting the solid under investigation. Average values of yg and y— are then derived. This can be avoided by rewriting Eq. (23):
The left-hand side of Eq. (24) equals WAB/2(y—)1/2 (see Eq. (16)). For a series of monofunctional and/or bifunctional test liquids used, one can plot WAB/2(y—)1/2 versus (yt/y—)1/2. This leads to a linear correlation with (yg)1/2 and (y—)1/2 as the intercept and slope, respectively. Application of this simple approach is shown in Fig. 4 (frequently used in the IGC literature, see below) to the contact angle data of Good and Hawa [77] obtained for PMMA, and those obtained for PPyCl by Azioune et al. [66]. It is very important to obtain positive values for (yg)1/2 and (y—)1/2 prior to the determination of
ys and y —.
For PMMA, yg = 0.1 and ys = 9.2mJ/m2, comparable to the average values determined using the sets (water/ethylene glycol) and (water/formamide). The set (ethylene glycol/formamide) cannot be used here because these liquids have very comparable (ygVy—)1/2 values as shown in Fig. 4. To plot such graphs one obviously needs to have test liquids with greatly differing values of (yj//y—)1/2. This is comparable to the situation occurring when the E and C parameters for materials are to be determined using test probes with appreciably different C/E ratios [13]. Therefore, the use of water as a probe liquid is strongly recommended in this regard. However, one also needs other liquids with an appreciable acidity, liquids with (yt/y—)1/2 ratios lying between 0.3 and 1 in order to improve the correlations similar to those plotted in Fig. 4.
Criticism (ii) is also unfair because it is well known that acid-base scales strongly depend on the choice of the test probes. For example, Gutmann’s DN scale is based on the
acid-base complexes of SbCl5, a soft acid. It can thus be considered as a scale of softness. In contrast, Gutmann’s AN scale is based on the complexes of (C2H5)3P=O, a hard test base, thus yielding a scale of hardness. Taken separately, the yS and yS values reported in show that they are very useful in establishing novel acidity and basicity scales as discussed above.
Criticism (iii) is fair but McCafferty and Wightman [62] have, for example, shown that using surface tension components for liquids based on the values yL = 65.0mJ/m2 and yL = 10mJ/m2 for water as suggested by Della Volpe and Siboni [76] yields the same trends of yS and yS values as determined for PVC and PMMA. Similar trends of yS and yS were obtained for PS lattices when the yL/yL ratio of 1.8 for water was used [63]. In trying different scales of yL and yL, caution must be exercised as some sets of values may lead to unacceptable results. This is the case for the water-formamide pair for which an interfacial tension was calculated to be 6.8mJ/m2 although these liquids are miscible [77].
Despite the criticisms above, the vOCG approach has been frequently and successfully used over recent years to interpret polymer solubility in water [14] (this is not possible using the ‘‘yp approach’’), protein adsorption on clays [57] and conducting polymers (see Section IV. A.2 below), cell adhesion to copolymer surfaces [65], yeast-yeast and yeast — bacteria adhesion [72], fiber-matrix adhesion [69], and the hydrodynamic detachment of colloidal particles from glass plates [70].
2. Application of the vOCG Theory to the Hydrophilic/Hydrophobic Interactions of Proteins with Polymer Surfaces
Recent work from our laboratory has dealt with human serum albumin (HSA) adsorption onto the conducting polymers PPyCl, PPyDS, and PPyTS [66] in an aqueous medium at pH 7.4. The PPy-HSA (1-2) interaction in water (w) can be expressed by
AG1w2 = y12 — y1w — y2w (25) where y12 is the interfacial tension between the two materials. Using the vOCG theory, Eq. (25) can be rewritten as a function of the surface tension components [57]:
2
AG1w2 =
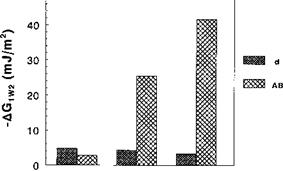
Numerical application of Eq. (26) to the PPy-water-HSA system yielded AG1w2 values of —7, —29.6, and —46mJ/m2 for PPyCl, PPyDS, and PPyTS, respectively. The negative values of AG1w2 indicate that the hydrophobic PPy-HSA interaction is favorable, and the values parallel the trends of HSA adsorption on the one hand, and the water receding contact angle (0w, r) on PPy surfaces on the other hand (0w, r = 27°, 43°, and 49° for PPyCl, PPyDS, and PPyTS, respectively). More importantly, the dispersive and acid-base contributions to AG1w2 (AGdw2 and AG^L, respectively) can be estimated from Eq. (26) and compared. Figure 5 depicts the extents of the dispersive and acid-base interactions for the PPy-water-HSA system for PPyCl, PPyDS, and PPyTS: there is a very strong
|
PPyCI PPyDS PPyTS Figure 5 Contributions of dispersive and acid-base components to the interfacial interaction energies of the HSA-polypyrrole film systems immersed in water (AG1w2). |
contribution of acid-base forces to the hydrophobic conducting polymer-protein interaction, especially in the case of PPyTS.
3. Contact Angle Titration
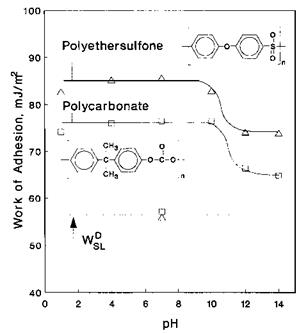
Contact angle titration (CAT) relies on the contact angle measurements of aqueous solutions of HCl or NaOH (preferably buffered solutions), with a pH ranging from 0 to 14. For monofunctional surfaces, the highest work of adhesion is obtained for low (high) pH solutions in contact with basic (acidic) surfaces. It should be noted that in this approach, the total yL value of the acidic and basic solutions is pH independent and equals that of distilled water. The value of WSdL with NaOH or HCl solutions can be calculated after evaluation of yS using apolar CH2I2, a-bromonaphthalene, or tricresylphosphate. From Eq. (12), the acid-base contribution WSL = WSL — WSdL.
An example of the assessment of the the acid-base properties by CAT is shown in Fig. 6 for poly(bisphenol A carbonate) (PBAC) and polyethersulfone (PES) surfaces. The titration curves show that both PES and PBAC are predominantly basic polymers since the highest WSL is obtained at low pH. It is very interesting to note in Fig. 6 that WSALB is slightly higher for PES, thus indicating a higher basicity, in agreement with an IGC study by Bolvari and Ward [78]. In a similar manner, low contact angles were obtained for Bronsted basic solution drops (high pH) at the surface of polyethylene carboxylic acid (PE-COOH), a Bronsted acidic polymer, indicating that acid-base interactions were maximized [79].
The CAT method has been applied to monitor the acid-base interactions of silica and carbon fibers [80], sintered silicon carbide [81], ammonia plasma-treated PP [82], and oxygen — plasma-treated PP [83] in relation to polymer metallization by evaporated aluminum [84]. In regards to the polymer-metal adhesion, it is also important to determine the IEPS of the metal oxide in question and this can be done by CAT. Experimentally, at the IEPS, the surface charge and concentration of dissociated hydroxyl groups are zero, and в (cos в) goes through a maximum (minimum) [62]. Since clean oxides are high surface energy materials, water or pH-controlled solution drops may spread on the surface. In this case the CAT method can still be applied in a two-liquid/solid system, the aqueous solution drop being deposited at the surface of the solid immersed in a hydrocarbon, for example, hexadecane [62].
|
Figure 6 Variation of the work of adhesion WSL versus pH for aqueous solution drops wetting polyethersulfone and polycarbonate. |
 24 июня, 2015
  Malyar

 Опубликовано в рубрике