7.6.5.1 Optical and Ultrasonic Lockin Thermography
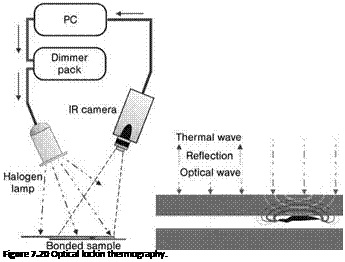
In optical lockin thermography (OLT), a thermal wave is produced on the entire surface of a sample by periodic irradiation with a infrared heat source, the intensity of which can be modulated (see Figure 7.20).
 |
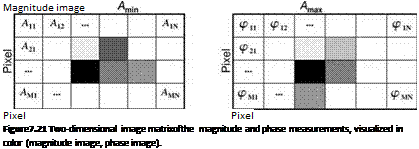
For each picture element, a thermographic camera records the thermal response of the surface that follows the periodic application of heat. The measurement is noncontact, and a PC is used to calculate the magnitude and phase of the temperature modulation induced in parallel for each pixel of the detector during the whole measurement period. The magnitudes and phases calculated for a given initial frequency, respectively, are visualized in color in the form of a magnitude image and a phase image (see schematic in Figure 7.21).
 |
As this method only reacts to a temperature modulation at a given excitation frequency, it is may be referred to as ‘excitation thermography’, ‘lockin thermography’, ‘phase-sensitive modulation thermography’ or ‘multiplex photothermal imaging’.
|
/— |
———— Л |
|
PC |
|
|
_ |
_______ J |
 |
With lockin thermography, the surface is subjected to a periodic (ideally sinusoidal) thermal stimulation. The temperature modulation is induced either on the surface of the sample and propagates as a thermal wave (external excitation, e. g. optically or by heated air), or within the sample (internal excitation, e. g. by means of ultrasound, microwaves, or electrically).
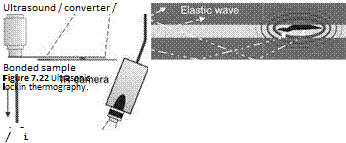
While external excitation makes it possible to detect interfaces that reflect the thermal wave, ultrasonic lockin thermography is based on internal excitation that requires a mechanical coupling of the ultrasound source with the sample (Figure 7.22).
With internal excitation, any flaws present produce a thermal wave; hence, this method is referred to as ‘defect-selective imaging’, a dark-field method that reacts very sensitively to areas with enhanced mechanical loss angle (Figure 7.23).
Lockin thermography provides for an interpretation of the magnitude and phase of the measured periodic temperature modulation at the surface in relation to the excitation. The phase signal is hardly disturbed by the emissivity distribution of the sample surface. When there is proper averaging — that is, sufficiently long periods of measurement — the method has an enhanced sensitivity for deep defects. A laboratory unit for lockin thermography, as performed at the Institute of Joining and Welding Technique, Technical University of Braunschweig (Germany), is shown in Figure 7.24.
 27 октября, 2015
  Pokraskin
  Опубликовано в рубрике