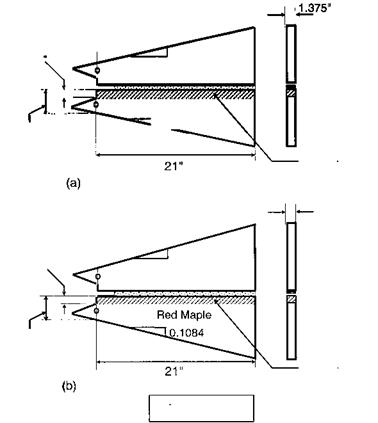
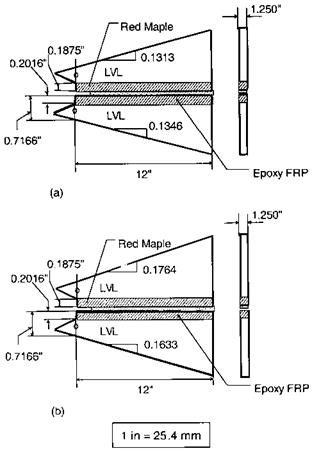
On the basis of the above design procedure, the geometries of linear-slope CDCB or TDCB specimens for dry and wet FRP-wood interfaces were designed for both phenolic (Fig. 13) and epoxy (Fig. 14) FRP-wood samples. The phenolic FRP-wood bonded interface (Fig. 13) consisted of E-glass/phenolic pultruded FRP, and an integral red maple adherend-contour combination; the adhesive used for the bonded interfaces was resorcinol formaldehyde (RF), and the optimum pressure and assembly times identified above through ASTM D2559 tests [4] were used in the bonding process. The epoxy FRP-wood bonded interface (Fig. 14) consisted of E-glass/epoxy filament wound FRP, and a thin layer of red maple adherend; the material used for the contour was yellow poplar laminated veneer lumber (LVL). The adhesive used for bonding the contour LVL and red maple adherends was RF and the contour LVL and epoxy FRP composite was bonded using Magnobond 56 (a two-part epoxy resin system.
|
|
|
|
|
|
|
|
|
|
|
|
|
|
|
|
|
![]()
Phenolic FRP
Figure 13 Shapes of CDCB phenolic FRP-wood specimens. (a) Geometry of phenolic FRP-wood/ dry specimen; (b) geometry of phenolic FRP-wood/wet specimen.
For dry samples, the specimens were conditioned to 12% wood moisture content in an environmental chamber. The wet specimens were obtained by submerging the samples in a water bath under a 40-min vacuum and 40-min pressure soaking cycle, the specimens were tested immediately after the end of the cycle. The vacuum/pressure soaking cycle was used to saturate the specimens with moisture contents beyond fiber saturation point [10], and the wet samples obtained by this process exhibited more than 100% moisture contents by weight. Once the geometries of linear-slope test specimens were defined, the specimens were calibrated, experimentally and analytically by finite element analysis, to achieve a linear rate of compliance with respect to crack length [12]. In this study, only the phenolic FRP-wood samples were experimentally calibrated; hence the experimental compliance rate change, dC/da (Table 8), is used in Eq. (1) to compute the fracture toughness for the phenolic FRP-wood interface. Based on the accuracy of predicting the compliance versus crack length relationship, as verified by experimental and numerical (Rayleigh-Ritz [8,12], modified Rayleigh-Ritz [15], and finite element analysis) studies for phenolic FRP-wood samples [5], the predicted values of dC/da are used in the computation of fracture toughness for epoxy FRP-wood interfaces (Table 8).
|
Figure 14 Shapes of CDCB epoxy FRP-wood specimens. (a) Geometry of epoxy FRP-wood/dry specimen; (b) geometry of epoxy FRP-wood/wet specimen. |
|
Table 8 Compliance Rate Change of Linear Tapered Specimens
RR, Rayleigh-Ritz; MRR, modified. Rayleigh-Ritz; Exp., experimental data; FEA, finite element analysis. |
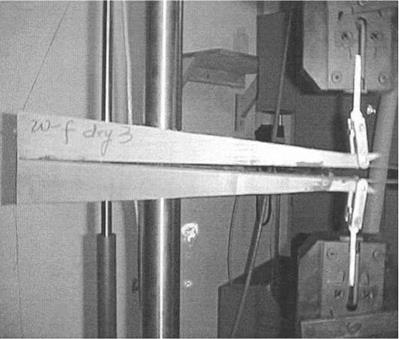
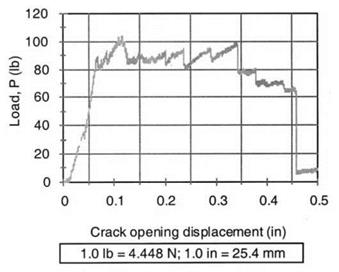
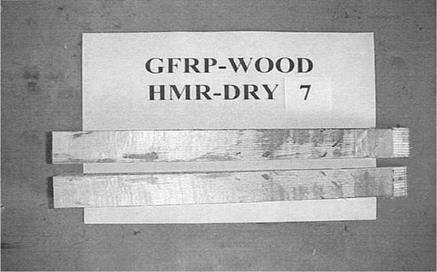
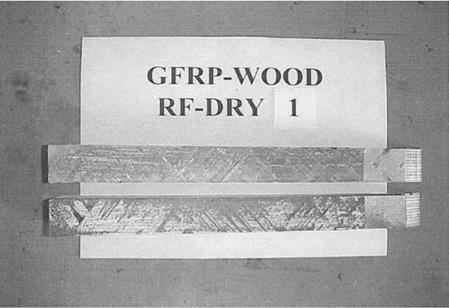
The linear-slope CDCB specimens shown in Figs. 13 and 14 were used for mode — I fracture tests on FRP-wood bonded interfaces under both dry and wet conditions. A typical specimen under mode-I fracture load is shown in Fig. 15 for phenolic FRP-wood interface under dry conditions, and the corresponding critical tip load versus crack opening displacement is plotted in Fig. 16. As an illustration, the fracture surfaces of epoxy FRP-wood with HMR and RF primers on wood substrates are shown in Figs. 17 and 18,
|
Figure 15 Fracture test on phenolic FRP-wood interface under dry conditions. |
|
Figure 16 Crack initiation and arrest loads for phenolic FRP-wood interface. |
respectively. In summary, the critical initiation and arrest loads, and fracture toughness values obtained for all of the tested samples discussed are shown in Tables 9 and 10, respectively [6]. As indicated in Table 9, an increase in interface fracture toughness due to moisture absorption was obtained for the phenolic FRP-wood and epoxy FRP-wood
|
Figure 17 Fracture surfaces of epoxy FRP-wood/HMR (specimen 7) under dry conditions. |
|
Figure 18 Fracture surfaces of epoxy FRP-wood/RF (specimen 1) under dry conditions. |
samples. The toughening of the interface under exposure to moisture is due mainly to a much more plastic fracture failure mode. Also, the effects of coupling agent on fracture toughness of epoxy FRP-wood interfaces under both dry and wet conditions were investigated; the fracture toughness of interfaces with HMR coupling is much higher than of those treated with RF (Table 10). The variability of critical loads for RF-treated wet samples was significant coefficient of variance (COV) = 80.3%, with values varying from
|
P (N) |
Pa (N) |
|
|
Phenolic FRP-wood/dry Phenolic FRP-wood/wet Epoxy FRP-wood/HMR/dry Epoxy FRP-wood/HMR/wet Epoxy FRP-wood/RF/dry Epoxy FRP-wood/RF/wet |
487.1 (COV = 15.4%) 700.6 (COV = 13.1%) 972.4 (COV = 8.0%) 1263.3 (COV = 6.4%) 472.9 (COV = 31.8%) 278.9 (COV = 78.0%) |
444.8 (COV = 17.0%) 653.4 (COV = 15.1%) 954.1 (COV = 8.8%) 1249.5 (COV = 6.5%) 433.7 (COV = 33.3%) 270.5 (COV = 80.3%) |
|
Table 10 Comparison of Fracture Toughness |
||
|
Glc (N/m) |
GaIc (N/m) |
|
|
Phenolic FRP-wood/dry |
224.15 |
185.63 |
|
Phenolic FRP-wood/wet |
450.06 |
390.52 |
|
Epoxy FRP-wood/HMR/dry |
444.81 |
432.55 |
|
Epoxy FRP-wood/HMR/wet |
705.73 |
689.97 |
|
Epoxy FRP-wood/RF/dry |
99.82 |
85.06 |
|
Epoxy FRP-wood/RF/wet |
35.02 |
31.52 |
about 10 lbs—130 lbs. The RF-treated wet samples achieved only about 5% of the fracture toughness of the HMR-treated wet samples. Thus, the primer type used has a major influence on the interface performance.
 15 июля, 2015
  Malyar
 Опубликовано в рубрике