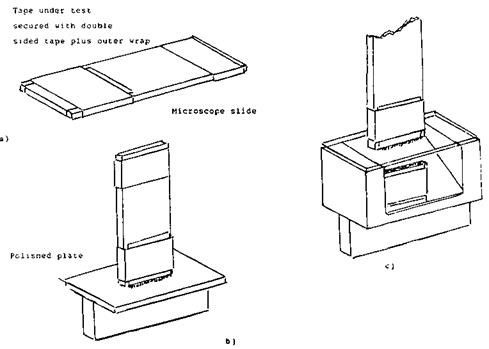
The work done in testing pressure-sensitive adhesives in the 0.01 in. (0.25mm)/min area has yielded an interesting new research test method, given the name of the butt tensile test. The standard 90° peel test is one of tensile stress, but there is a continuous change in the adhesive under examination as the peel front recedes. By rearranging the geometry so that a limited fixed area of adhesive is under a continuous tensile stress, a new and informative test can be performed on the adhesive. For this test, a tensile tester with the ability to accurately record values covering the 2.0 lb (1000 g) range is necessary, test results by this method typically falling into this range. First, the adhesive-coated tape under evaluation is prepared for testing by securing it, adhesive out, to a microscope slide in such a manner that a narrow strip of exposed adhesive at the end of the slide can be evaluated (Fig. 9a). The opposite end of the microscope slide is wrapped to give the tester jaws a better grip. This assembly is then mounted in the upper jaws of the tensile tester. With the tester set on the 2.0 lb (1000 g) scale and the return speed of the tester set at a suitably low value, starting at 5 in. (125 mm)/min, the narrow strip of exposed adhesive at the end of the microscope slide is then brought into contact with a polished horizontal test surface that has been mounted in the lower jaw of the tester, adjustments being made to the slide if necessary to ensure that the two surfaces are parallel (Fig. 9b).
Slight pressure is then brought to bear to ensure intimate contact. One way this can be achieved is the use of a tester fitted with an extension/compression strain gauge, setting
|
Figure 9 Butt tensile test: (a) sample preparation; (b) tensile tester set-up; (c) 45° mirror set-up. |
|
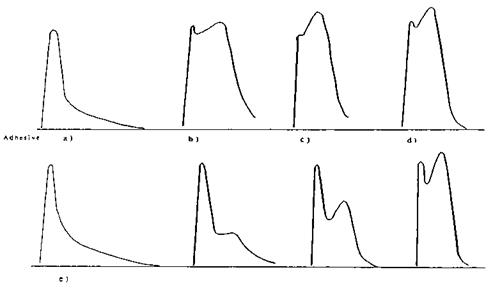
Figure 10 Typical butt tensile test graphs: (a) undercured, (b) cross-linked, (c) overcured, and (d) block copolymer adhesives; (e) stages in the cross-linking of a pressure-sensitive adhesive. |
the zero of the recorder at a position 5% from the zero of the full scale deflection, followed by recalibration of the scale. The lower jaws are slowly raised until sufficient compression is applied to the bond to return the recorder pen to zero. The drive is then stopped and the application force held for 10 s. The lower jaw is then slowly lowered until the applied stress returns to zero. The set-up is allowed to relax for 2 min to relieve any stress within the adhesive. A tensile test is now carried out on the bond at 0.01 in. (0.25mm)/min with the recorder set at 1.0 in. (25mm)/min. Typical curves that can be generated are shown in Fig. 10. The shapes of the curves obtained are independent of width, which affects only the amplitude, and so compensation can be made for the sample width available by calculation, as for adhesion testing. As the fibers are delicate, the equipment should be made as vibration free as possible.
Another variation in the test surface is to use a second microscope slide and, using a suitable set-up, mount a 45° mirror below. Then it can be ensured visually that adequate contact is being achieved (Fig. 9c), and further, the mechanism of failure can be studied. This method was used successfully initially to ensure the viability of the test method.
A description of these curves, and a possible interpretation follow. The very slow speed of testing allows for cavitation, molecular disentanglement, and the formation of adhesive fibers which are then drawn out until adhesive failure at the polished surface takes place. The length of these fibers is many times the original thickness of the adhesive. One can make the analogy that the adhesive consists of a broad spectrum of polymer structures. At one end of this spectrum, fibers are formed that require a considerable force to elongate, but the degree of elongation is low. At the other end of the spectrum, fibers are formed with a very high elongation, which it takes little effort to extend. The former fibers are those that contribute to adhesion, while the latter contribute to tack. If the adhesive polymer structure is chemically cross-linked, or has pseudo-cross-links, as in a block copolymer, then the fiber extension process is restricted and orientation occurs, resulting in the formation of a secondary peak. The ratio of the primary to the secondary peaks is a measure of the cure level for that adhesive. If a series of tests are carried out on an adhesive at various stages in its cure cycle, not only will the secondary peak gradually build, but the tail of the curve is also gradually lost, no doubt due to the lower-molecular — weight components, the most mobile, being taken up in the curing process (Fig. 10).
Adhesive systems showing high adhesion levels by conventional methods naturally show a high value of the primary peak, the area under the curve denoting the work done in separation. Un-cross-linked systems show no secondary peak (Fig. 10a). Adhesives with a high degree of cure show a high value secondary peak (Figs. 10b and c), the pseudo-crosslinking of block copolymers showing the highest, and depending on adhesive design, often higher than the primary peak (Fig. 10d).
This technique can therefore provide various pieces of information in a single test. It can be used to evaluate the degree of cure of a given system once a standard has been determined and evaluated (Fig. 10e). The tail is a reflection of the low-molecular-weight component; adhesives with a low-molecular-weight plasticizer will show an exceptionally long tail. Such systems in practical use would be expected to show a tendency to lift after application. The method can thus highlight the cause of failure and identify poor design. Other potential uses for this test method will present themselves as the user becomes more familiar with its operation.
 8 июля, 2015
  Malyar

 Опубликовано в рубрике