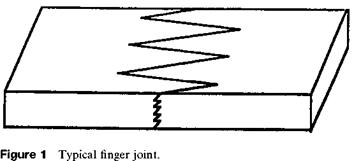
Given the choice, a designer seldom uses adhesives in a direct tensile loading mode. The primary reason for this is probably related to the fact that by overlapping, scarfing, and so on, the contact area of the adhesive may be markedly increased over that of a simple butt joint. The finger joints used to produce longer pieces of lumber or in other wood construction are a familiar example of such techniques. Figure 1 clearly demonstrates the difference in bond area between a butt joint and one of the types of finger joint assemblies
|
|
described in ASTM D-4688. It is noted that this geometry also results in a change in the stress state. The butt joint appears to be dominated by tensile stresses (superficially at least). Differences in elastic-viscous-plastic properties between the adhesive and adher — ends induce shear stresses along the bond line even for the case of the pure butt joint, but the dominant ‘‘direct’’ stresses are tensile. (This is perhaps an opportune point to note that, as explained in more detail later, the stress distribution in joints is almost never as simple as it might first appear.) Clearly, for the tensile-loaded finger joint, shear stresses as well as tensile stresses are applied directly to the bond line. Another reason why tensile joints are avoided in design is because it has been observed empirically that many adhesives exhibit lower strength and high sensitivity to alignment when exposed to butt-type tensile stresses.
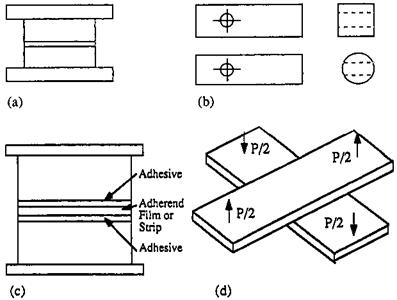
However, a variety of standard tensile tests are available. Sample geometries for some of the more common of these are shown schematically in Fig. 2. Figure 2a is a schematic representation of the configuration from ASTM D-897. It is used (with slight geometric alterations) for various adherends, ranging from wood to metal. It is often called the, ‘‘pi tensile test’’ because the diameter is generally chosen to yield a crosssectional area of one square inch. Detailed specifications for U-shaped grips machined to slip over the collar on the bonded spool-shaped specimen, to help maintain alignment during loading, are given in the same standard. Our experience has been, however, that even with such grips, reasonable care in sample manufacture, and acceptable testing machine alignment, it is difficult to apply a really centric load. As a consequence, such experiments often exhibit quite large data scatter [1,2]. The specimens for ASTM D-897 are relatively costly to manufacture. To reduce this cost, ASTM D-2094 specifies the use of simpler bar and rod specimens for butt tensile testing. The D-2094 half specimens show in
|
Figure 2 Tensile adhesion test geometries: (a) pi tensile test, ASTM D-897; (b) bar and rod tensile test, ASTM D-2094; (c) sandwich tensile test, ASTM D-257; (d) cross-lap tension test, ASTM D-1344. |
Fig. 2b are loaded by pins through the holes. The testing specification also describes a fixture to assist in sample alignment, but this still remains a problem.
The specimens of both ASTM D-897 and D-2094 can be adapted for use with materials that cannot readily be manufactured into conventional specimen shapes, by the approach shown schematically in Fig. 2c. Such materials as plates of glass or ceramics and thin polymer films can be sandwiched between the spool-like sections made of materials that can be more readily machined such as metals. Obviously, to obtain meaningful results from this test, the strength of the adhesive bond to the spool segments must be greater than that to the thin film or sheet.
ASTM D-1344 describes a cross-lap specimen of the type shown in Fig. 2d for determining tensile properties of adhesive bonds. Wood, glass, sandwich, and honeycomb materials have been tested as samples in this general configuration. Even under the best of circumstances, one would not anticipate the stress distribution in such a case to be very uniform. The exact stress distribution is highly dependent on the relative flexibilities of both the cross beams and the adhesive. Certainly, caution must be exercised when comparing tensile strength from this test with data obtained from other tensile tests. Probably for these reasons, this test is scheduled by ASTM for discontinuation.
The results from these ‘‘tensile’’ tests are normally reported as the force at failure divided by the cross-sectional area. Such average stress information can be misleading. The importance of alignment has already been discussed. Even when alignment is ‘‘perfect’’ and the bonds are of uniform thickness over the complete bond area, the maximum stresses in the bond line can differ markedly from the average stress [3,4]. The distribution of stresses along the bond line is a strong function of the adhesive joint geometry. This is demonstrated in Fig. 3, which shows both the normal and shear stress distribution as a function of position for specimens of the general shape shown in Figs. 2a and b. These calculations assume an elastic adhesive that is much less rigid than the steel adherends and with a Poisson ratio of 0.49. The various curves in Fig. 3 represent differing diameter/ adhesive thickness ratios, shown as the parameters listed for each curve. Note that both the normal stresses and the induced shear stress vary dramatically over the bonded surface. As described later, an understanding of stress and strain distribution in the adhesives and adherends is useful in fracture mechanics analysis. The average stress results commonly reported from standard tensile tests must be used with great caution in attempts at predicting the strength of different joints, even where the joints may be superficially similar. References 2 and 4 use numerical and experimental techniques to explore the effect of adhesive thickness on the strength of butt joints. The analysis and associated experimental results in these references illustrate that the strength of the joint and the locus of the point from which failure initiates are highly dependent on the adhesive thickness/ diameter ratio.
 6 июля, 2015
  Malyar

 Опубликовано в рубрике