a. Determination of DGAB and DHAB. If ‘‘polar’’ probes interact via acid-base forces with the stationary phase, then AGa has a contribution from such specific interactions. Assuming that dispersive and acid-base interactions are additive, then AGab, the acid-base contribution to the free energy of adsorption, is deduced from AGa by
-AGab = -(AGa — AGb = RT ln Vn (33)
V N, ref
where VN and VN>ref are the net retention volumes of the polar probe and a hypothetical reference n-alkane having the same physicochemical property, respectively. There are
|
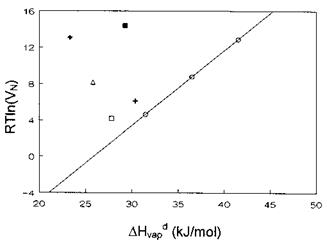
Figure 8 RT ln(VN) versus AHvdp for alkanes and polar probes adsorbed onto PPyTS at 35°C. (O) C6-C8; (□) CH2Q2; ( + ) CHCl3; (i) diethylether; (■) EtAc; (♦) THF. |
various approaches to the assessment of AGab in which the probes can be characterized by: the boiling point [121]; the logarithm of the vapor pressure [122]; a(yL)1/2 [95] (where a and yL are the cross-sectional area of the probe and the dispersive contribution to the surface tension, respectively); the deformation polarizability [99]; and AHdap, the dispersive contribution to the heat of vaporization [123]. All these methods have advantages and shortcomings which have been discussed elsewhere [123,124].
Practically, AG^ is determined as shown in Fig. 8 where the variation of RT ln (VN) versus AHvdap is plotted for tosylate-doped polypyrrole (PPyTS), a conducting polymer, at 35°C. The data for the n-alkanes lead to a linear correlation which defines the dispersive interactions for the PPyTS-probe pairs. For ‘‘polar’’ probes interacting via acid-base interactions, the corresponding markers will lie above the reference line with a vertical distance that accounts for AG^. In Fig. 8, the markers corresponding to the ‘‘polar’’ probes lie significantly above the reference line defined by the n-alkanes, thus indicating that PPyTS behaves amphoterically. However, the AG^ values are significantly much higher for the Lewis bases (EtAc, THF, and diethylether) than for the acidic species CHCl3 and CH2Cl2, an indication that PPyTS has a predominantly acidic character.
АЯУ is usually determined from the temperature dependence of AGab:
AT^ = — AS (34)
In practice, for a given acidic or basic probe, plotting R ln(VN/VN, ref) versus 1/T results in a linear correlation whose slope equals — AH^. An example is given in Fig. 9 for the adsorption of CH2Cl2 onto a carbon fiber surface.
An alternative approach to Eq. (34) has been proposed [40,42,125]:
Afff = (AHa — AHad)probe — (AHa — AHad)model (35)
where AHa is the absolute value of the total heat of adsorption and AHad its dispersive contribution. The model probe must be neutral and of comparable size to that of the ‘‘polar’’ probe or have a comparable boiling point. If the probes have a negligible
degree of self-association, then AHad can be replaced by AHvap, the heat of vaporization. Alternatively, AHad could be estimated from the adsorption (for either probe or model) onto an apolar material such as polyethylene. Equation (35) has been used to derive the E and C parameters for conducting polymers [40,41] and glass beads [42] (see Table 3).
b. Determination of Donor and Acceptor Constants. Saint Flour and Papirer [122] suggested to combining AHAB values with Gutmann’s DN and AN values in order to determine the acid-base parameters of materials:
—A HAB= DNxKa+ AN*xKd (36)
where KA and KD are the acidity and basicity descriptors, respectively. Equation (36) can be rewritten as
![]()

—A HAB DN
AN* = AN* Ka + Kd
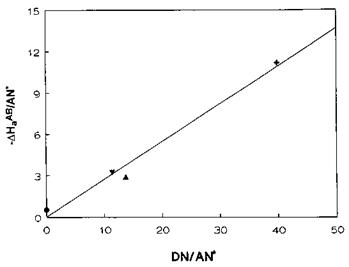
where AN* is the acceptor number corrected for van der Waals interactions. In practice, and for each probe, —AH^/AN* is plotted versus DN/AN* and the resulting linear correlation has a slope and intercept corresponding to KA and KD, respectively (see Fig. 10). Belgacem and Gandini [85] compiled a large set of KA and KD constants for various types of materials. These acid-base descriptors are reported in Table 9 for a selection of materials.
Kuczynski and Papirer [92] as well as Chehimi et al. [104] found that it was also simple to derive KA and KD values from the following equation:
—AGab= DNxKa+ AN*xKd (38)
|
Figure 10 Plot of —AH^8/AN* versus DN/AN* for PPyTS. The slope and the intercept permit determination of KA and KD for PPyTS. (•) chloroform; (▼) EtAc; (A) diethyl ether; ( + ) THF. |
Although fundamentally this approach is not correct because it relates AGab values to Gutmann’s numbers which are derived from AHab terms, it has proved to be a fast and effective semiquantitative approach to monitoring-changes in the surface properties of fillers and polymers [92,104,108,122,130]. It does not necessarily mean that the entropic term is ignored so that AGab = AHab. It simply produces different scales of KA and KD constants, but at one given temperature. In our laboratory, we found it very suitable for materials, such as conducting polypyrrole, which may degrade quite rapidly during their IGC characterization [110]. van Asten et al. [86] also agree that a single IGC characterization of a material (carbon fiber) batch could be performed in a couple of hours, hence the interest in this approach.
As far as conducting polymers are concerned, the change in the surface composition of conducting polymer powders has been monitored following coating with PMMA [104] and PVC/PMMA blends [131] (see Table 10). CHCl3 and THF were chosen as reference acidic and amphoteric probes, respectively. The advantage in using this set of probes lies in the large difference between their DN/AN* ratios (0 for CHCl3 and 39.9 for THF), which permits accurate determination of KA and KD for the sorbent under test.
The acid-base descriptors derived from AGab values clearly permit monitoring of the change in the surface thermodynamics of PPyNO3 powder as a result of coating by PVC and PMMA blends. The KA/KD ratios so derived suggest that PMMA is depleted towards the surface of the blend-coated PPyNO3 powder. This is explained by the intermediate KA/KD ratios found for the blend-coated conducting polymer by comparison to those determined for the reference PMMA, PVC, and PPyNO3.
An alternative method for the determination of acid-base characteristics of solids was proposed by Lara and Schreiber [94] who defined
KA= — AGab(THF) (39a)
|
Material |
Treatment |
Ka |
KD |
KA/KD |
Ref. |
|
PAN-based |
None |
6.5 |
1.5 |
4.3 |
95 |
|
C fiber |
|||||
|
Oxidation |
10 |
3.2 |
3.1 |
95 |
|
|
Sizing |
8.6 |
13.0 |
0.7 |
95 |
|
|
Epoxy I |
7.6 |
6.2 |
1.2 |
95 |
|
|
T300 |
None |
0.143 |
15 |
0.0095 |
96 |
|
Oxidized |
0.222 |
32 |
0.0069 |
96 |
|
|
sized |
0.206 |
130 |
0.001 6 |
96 |
|
|
PEEK |
powder |
9.6 |
48 |
0.002 |
96 |
|
PEEK |
fiber |
0.06 |
108 |
0.00055 |
96 |
|
PE fibers |
None |
0 |
0 |
126 |
|
|
Ozonation 2h |
3.5 |
0.8 |
4.4 |
126 |
|
|
Ozonation 3 h |
3.3 |
1.0 |
3.3 |
126 |
|
|
First degree of oxyfluorination |
7.3 |
2.5 |
2.9 |
126 |
|
|
Second degree of oxyfluorination |
10.3 |
9.2 |
1.1 |
126 |
|
|
Natural |
None |
1.24 |
0.83 |
1.49 |
127 |
|
Graphite |
|||||
|
n-BuOH plasma |
1.37 |
0.89 |
1.54 |
127 |
|
|
n-BuNH2 plasma |
0.38 |
0.87 |
0.44 |
127 |
|
|
PPyTS |
0.273 |
0.026 |
10.5 |
41 |
|
|
PPyCl |
0.261 |
0.436 |
0.6 |
41 |
|
|
POT |
0.138 |
0.298 |
0.46 |
128 |
|
|
PTEDM |
None |
0.133 |
0.668 |
0.20 |
129 |
|
Annealed, He 160° C |
0.092 |
0.48 |
0.19 |
129 |
|
|
Annealed, air 160°C |
0.106 |
0.745 |
0.14 |
129 |
|
|
PNDM |
None |
0.122 |
0.551 |
0.22 |
129 |
|
Annealed, He 160°C |
0.136 |
0.754 |
0.18 |
129 |
|
|
Annealed, air 160°C |
0.119 |
0.962 |
0.12 |
129 |
|
|
Alumina |
Pure |
12.2 |
6.3 |
1.9 |
90 |
|
1000 ppm silica |
20.5 |
8.1 |
2.5 |
90 |
|
PAN, Epoxy I, DGEBA (diglycyl ether of bisphenol A) epoxy resin with 35% w/w of diamino diphenyl sulfone hardener, T300, polyacrylonitrile (PAN)-based C fiber; PTEDM, poly(2,2′-thiobisethanol dimethacrylate); PNDM, poly(A-methyldiethanolamine dimethacrylate). Oxyfluorination is a proprietary treatment of Air Products and Chemicals that results in surface oxidation and fluorination of fibers. |
|
Table 10 KA and KD Constants Derived from AGab values, and KA/KD Ratios for PPyNO3 Before and After Coating with PVC and PMMA Blends (48°C)
Data taken from [131]. PMMA and PVC were coated onto PPyNO3 from THF or dioxane. Initial concentrations of PMMA/PVC in g/l were 0.88/0.88, 1.56/0.88, and 2.64/0.88. |
|
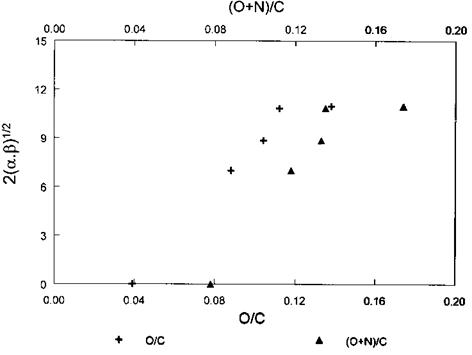
Figure 11 Plot of overall acid-base index versus O/C and (O+N)/C atomic ratios. The acid-base index 2(afi)1/2 was determined by IGC and the atomic ratios by XPS. (Reprinted from Ref. [112].) |
and
KD = — AGAB(CHCl3) (39b)
This is another simple empirical approach to assess acid-base properties of polymers and fillers. Of course, one can use other reference acids and bases if they are more suitable for the solid under test.
Recently, Vickers et al. [112] defined the constants in (39a) and (39b) as a and fi, respectively, and suggested describing the overall acid-base character of the materials under test (PAN-based carbon fibers) by 2(a, fi)1/2 (in kJ/mol). Figure 11 depicts a plot of the acid-base descriptor 2(a, fi)1/2 versus the heteroatom content of the PAN-based C fiber surface for different degrees of fiber treatment. This illustrates the change in the acid-base characteristics of the various fibers.
3. Fiber-Matrix and Filler-Matrix Specific Interaction Parameters
Using KA and KD constants for polymer matrices (m) and fillers or fibers (f), one may
define the pair specific interaction parameter (Isp):
Isp = KA Km + ktkD (40)
Equation (40) was proposed by Schultz et al. [95] in their study of carbon fiber-epoxy composites, the KD and KA parameters being derived from AHab values (Eq. (36)). These authors found a linear relationship between the interfacial shear resistance r and Isp
(Fig. 12) and concluded that interfacial adhesion resulted from mainly acid-base interactions between the fiber and the matrix.
Following a similar approach, Lara and Schreiber [94] defined an interaction parameter to rationalize the acid-base forces at pigment-resin interfaces:
Isp = ОВД )1/2+ (KA KjD)1/2 in kJ/mol (41)
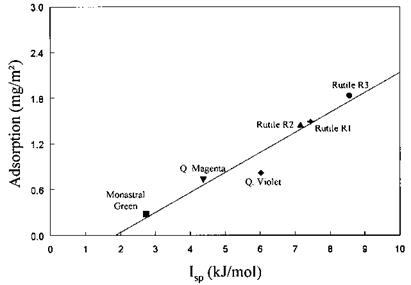
where the constants KA and KD were determined using Eqs. (39a) and (39b) for pigments (p) and resins (r). /sp was then related to the adsorbed amount of polyester dispersion and binder resins onto rutile and organic pigments. Figure 13 depicts the relationship between adsorption and /sp for an amine-modified polyester dispersion resin adsorbed onto mineral and organic pigments. It gives strong evidence that acid-base interactions are dominant in determining the adsorption behavior of polymer/pigment combinations.
4. Linear Solvation Energy Relationship
The above IGC approaches permit determination of ^ and acid-base parameters for solid surfaces, however, without the possibility of deducing them from one single equation. The linear solvation energy relationship (LSER) [75] permits connection of a measured value (e. g., partition coefficient) to the physicochemical parameters of the solute and the solvent (e. g., polymers in the liquid or viscous state) by a five-parameter equation:
AG ffi log KL = c + rR2 + sn + baf + а$ + l log L16 (42)
where AG is the free energy of sorption of the solute and KL the liquid support/mobile phase partition coefficient. The parameters R2, Щ, aH, ^H, and log L16 characterize the solute and the constants c, s, a, b, and l characterize the solvent (gas chromatographic support) and are obtained by multiple linear regression analysis. The explanatory variables are solute parameters, R2 an excess molar refraction (polarizability), n2 the solute dipolarity-polarizability (polarity), and $ the solute hydrogen bond acidity and basicity,[3] and log L16 a dispersion interaction term where L16 is the gas/liquid partition coefficient of the solute on hexadecane at 25°C. Provided that the variety of solutes studied covers suitable ranges of the descriptors, the coefficients in the above equation then characterize the particular condensed phase (support) in terms of specific interactions. Thus r is the tendency of the phase to interact through n — and n-electron pairs, s is the phase dipolarity-polarizability, b is the phase (hydrogen-bond) basicity, a is the phase (hydrogen-bond) acidityy, and l is a constant that reflects a combination of cavity effects and general dispersion interactions and is related to the ability of the phase to distinguish between or to separate homologues in any homologous series. The constant c is a fitting parameter. Table 11 reports van der Waals (dispersion, polarity,
|
|
|
|
Table 11 Dispersion (/), Polarity (s), Polarizability (r), Basicity (b), and Acidity (a) Solvation Parameters for Polymers, Molten Salts, and Conventional Liquid Stationary Phases
c is a fitting parameter derived from the five-parameter Eq. (42). PMHS, poly(methyl hydrosiloxane); PLF, linear hexafluoro dimethyl carbinol-functionalized polysiloxane; PBF, branched hexafluoro dimethyl carbinol-functionalized polysiloxane; PMTFPS, poly(methyl-3,3,3,-trifluoropro — pylsiloxane); PCPMS, poly(methyl cyanopropylsiloxane); SXCN, poly{oxy[bis(3-cyanopropyl-1-yl)silylene]}; PPE, poly(phenylether); TBTS (molten salt), tetrabutylammonium 4-toluene sulfonate; TBP (molten salt), tetra — butylammonium picrate; FPOL, fluoropolyol; P4V, poly{1-[4-(2-hydroxy-1,1,1,3,3,3-hexafluoropropyl-2-yl)phe — nyl]ethylene}; PEI, poly(ethyleneimine). |
and polarizability) and acid-base constants assessed by the LSER method for polymers, conventional gas-liquid chromatographic stationary phases, and molten salts.
As far as polysiloxanes are concerned, Demathieu et al. [132] showed that hexafluoro dimethyl carbinol-functionalized polysiloxanes exhibited a very strong acidity in comparison to PMHS, whereas the cyano-functionalized polysiloxanes had significantly high basicity values. The SXCN is much more basic than PCPMS since SXCN has two cyano pendent groups whilst PCPMS has only one.
It is important to note that the partition coefficients are strongly temperature dependent with a subsequent decrease in sorption with increasing temperature. Therefore, the solvation parameters determined for polymers used in sensor technology must be determined close to room temperature, that is at normal operating conditions of sensors, otherwise the sensitivity and selectivity of sensors will be underestimated. Table 11 actually indicates a sharp decrease in the acidity (a), basicity (b), and dispersion (/) parameters as a result of increasing temperature in for example FPOL, a fluoropolyol.
Clearly, the adhesion community should consider the LSER approach when IGC characterization of material surfaces is concerned. The price to pay, however, is to use a large number of solutes, at least 20-30 probes (parameters are available for 2000 organic molecules [133]), to derive accurately five solvation constants for the sorbents under test.
This is not usually done in the actual IGC studies relevant to adhesion science where yS is determined using three or four n-alkanes, and the KA and KD constants estimated with only a few acids and bases.
 24 июня, 2015
  Malyar


 Опубликовано в рубрике