Two specimens (having ERs of 0.4 and 0.8) were instrumented by strain gages for the estimation of the coupling pressure and of the coefficient of friction. Detailed results are shown in Table 3: an average coefficient of friction of 0.17 was determined.
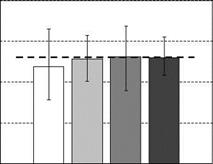
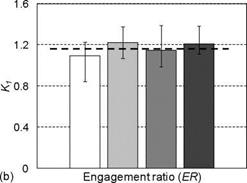
All the results, in particular the amount of force sustained by the adhesive, Fad, the strength Tad, and the ratio Kh are shown in Table 4. The results, for rad, and Kj are compared in histograms in Figure 6, together with their intervals. Considering all the tested shaft-hub pairs (independently of the ER), the shear strength has a mean value of 26.2MPa and an overall standard deviation of 5.13MPa, while the K ratio is on average around 1.17: these levels also are reported (with a dashed line) in Figure 6.
|
Table 3. Summary of the results for PFJs, determination of the friction coefficient (second campaign)
|
PFJs
|
ER
|
U [mm]
|
Z [mm]
|
Pc [MPa]
|
Ftot=Fint [kN]
|
Pa
|
|
1
|
0.4
|
0.005
|
0.002
|
80
|
2.7
|
0.13
|
|
2
|
0.8
|
0.005
|
0.002
|
62
|
6.5
|
0.21
|
|
Mean
|
|
0.005
|
0.002
|
71
|
4.6
|
0.17
|
|
|
Table 4. Summary of the results for HJs with ER=0.4; 0.8; 1.3; 1.7 (second campaign)
|
HJs (ER=0.4)
|
U [mm]
|
Fcoupi [kN]
|
Ftot [kN]
|
rad [MPa]
|
Ki
|
|
1
|
0.008
|
4.9
|
4.7
|
18.5
|
0.97
|
|
2
|
0.005
|
6.2
|
7.4
|
35.0
|
1.20
|
|
3
|
0.008
|
5.2
|
6.4
|
31.8
|
1.23
|
|
4
|
0.009
|
4.4
|
5.4
|
25.7
|
1.21
|
|
5
|
0.014
|
6.8
|
5.8
|
17.6
|
0.84
|
|
Mean
|
0.009
|
5.5
|
5.9
|
25.7
|
1.09
|
|
St. Dev.
|
0.003
|
1.0
|
1.0
|
7.8
|
0.17
|
|
HJs (ER=0.8)
|
U [mm]
|
Fcoupi [kN]
|
Ftot [kN]
|
Tad [MPa]
|
Ki
|
|
6
|
0.004
|
13.0
|
13.9
|
31.7
|
1.07
|
|
7
|
0.004
|
10.3
|
10.9
|
24.0
|
1.07
|
|
8
|
0.005
|
9.6
|
12.8
|
27.6
|
1.33
|
|
9
|
0.005
|
8.7
|
10.2
|
21.7
|
1.17
|
|
10
|
0.008
|
9.2
|
12.6
|
24.3
|
1.38
|
|
11
|
0.003
|
11.0
|
14.3
|
33.0
|
1.30
|
|
Mean
|
0.005
|
10.3
|
12.5
|
27.1
|
1.22
|
|
St. Dev.
|
0.002
|
1.6
|
1.6
|
4.5
|
0.14
|
|
HJs (ER=1.3)
|
U [mm]
|
Fcouvi [kN]
|
Ftot [kN]
|
Tad [MPa]
|
Ki
|
|
12
|
0.004
|
17.1
|
18.7
|
30.5
|
1.09
|
|
13
|
0.004
|
19.1
|
18.9
|
29.7
|
0.99
|
|
14
|
0.006
|
17.8
|
19.3
|
27.4
|
1.08
|
|
15
|
0.006
|
9.4
|
13.1
|
18.1
|
1.39
|
|
16
|
0.003
|
11.5
|
12.2
|
20.1
|
1.06
|
|
17
|
0.003
|
16.2
|
21.4
|
33.9
|
1.32
|
|
18
|
0.004
|
15.7
|
16.8
|
24.6
|
1.07
|
|
Mean
|
0.004
|
15.3
|
17.2
|
26.3
|
1.10
|
|
St. Dev.
|
0.001
|
3.5
|
3.4
|
5.7
|
0.15
|
|
HJs (ER=1.7)
|
U [mm]
|
Fcouvi [kN]
|
Fot [kN]
|
Tad [MPa]
|
Ki
|
|
19
|
0.004
|
17.7
|
19.7
|
21.6
|
1.11
|
|
20
|
0.002
|
23.6
|
26.3
|
30.9
|
1.11
|
|
21
|
0.003
|
18.0
|
23.8
|
26.3
|
1.32
|
|
22
|
0.003
|
17.7
|
20.9
|
27.1
|
1.18
|
|
23
|
0.002
|
16.2
|
18.7
|
22.2
|
1.16
|
|
24
|
0.003
|
17.1
|
23.6
|
26.5
|
1.38
|
|
Mean
|
0.003
|
18.4
|
22.2
|
25.8
|
1.21
|
|
St. Dev.
|
0.001
|
2.6
|
2.9
|
3.4
|
0.11
|
|
|
|
|
aER=0.4
aER=0.8
aER=1.3
aER=1.7
General "" mean
|
|
|
|
|
|
 |
|
|
|
aER=0.4
VER=0.8
UER=1.3
aER=1.7
General ” mean
|
|
|
Figure 6. Adhesive shear strengths Tad (a) and Kd (b) coefficients compared for different values of ER (second campaign on HJs).
|
|
|
aER=0.4
UER=1.7
General ” mean
|
|
|
|
|
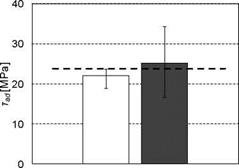
Figure 7. Adhesive shear strengths Tad compared for different values of ER (campaign on SFJs).
|
|


 20 октября, 2015
  Pokraskin
  Опубликовано в рубрике