The important physical data for inorganic pigments comprise not only optical constants, but also geometric data: mean particle size, particle size distribution, and particle shape [1.12]. The standards used for the terms that are used in this section are listed in Table 1.1 (“Particle size analysis”).
The concept of particles and particle shape corresponds to that used in the recommended and internationally accepted classification of pigment particles given in Ref. [1.13] (see Figure 1.1 and Table 1.5).
The term particle size must be used with care, as is borne out by the large number of different “particle diameters” and other possible terms used to denote size (see Table 1.6). In granulometry, so-called shape factors are sometimes used to convert equivalent diameters to “true” diameters. However, the determination and use of shape factors is problematic.
In practice, empirically determined particle size distributions are represented by:
|
Cuboid |
Primary particles Spherical Rod shaped |
Irregularly |
|
|
о iti |
shaped Q |
||
|
p % |
|
Coherent scattering lattice regions (crystallites) |
 Fig. 1.1 Primary particles, agglomerates, and aggregates.
|
Tab. 1.5: Definitions of particles and associated terms (see also Fig. 1.1)
|
1. Tabulated results
2. Graphical representation in the form of a histogram (bar chart) or a continuous curve
3.
 |
Approximation in the form of analytical functions
Tab. 1.6: Particle size, particle size distribution, and characteristic quantities
![]()

 Definition
geometrical value characterizing the spatial state ofa particle diameter of a spherical particle or characteristic dimension of a regularly shaped particle
diameter ofa particle that is considered as a sphere
surface area of a particle: a distinction is made between the internal
and external surface areas
volume of a particle: a distinction is made between effective volume (excluding cavities) and apparent volume (including cavities) mass ofa particle density ofa particle
statistical representation of the particle size of a particulate material gives the relative amount of a particulate material in relation to a given particle size diameter. Density distribution functions must always be normalized
normalized sum ofparticles that have a diameter less than a given particle size parameter
a fraction is a group ofparticles that lies between two set values of the chosen particle size parameter that limits the class the mean values of particle size parameters can be expressed in many ways, some values are used frequently in practice parameter for characterizing the nonuniformity of the particle size
For standards see Table 1.1 “Particle size, representation”. Special distribution functions are specified in some standards (e. g., power distribution, logarithmic normal distribution, and RRSB distribution). The representation of particle size distributions and methods for their determination are described elsewhere. Methods of determination for pigments are rated in Section 1.2.2.
The important parameters relating to particle size distribution are the meanparticle size and the spread of the distribution. The way of expressing the mean particle size depends on the test method used or on which mean value best reflects the pigment property ofinterest. Depending on the spread ofparameter, the various mean values for a given particulate material can differ considerably. The mean particle sizes of inorganic pigments lie in the range 0.01-10 pm, and are usually between 0.1 and 1 pm.
The specific surface area also represents a mean of the pigment particle size distribution. It can be used to calculate the mean diameter of the surface distribution. Care must be taken that the effect of the “internal surface area” is taken into account. If the product has an internal surface area, which cannot be neglected in comparison to the external surface area, then the measured specific surface area no longer gives a true measure ofthe mean diameter. This applies, for instance, to aftertreated pigments, because the treatment material is often very porous.
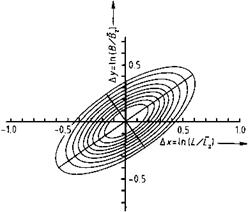
For anisomeric particles (e. g., needle — or platelet-shaped particles) mathematical statistics may likewise be applied [1.14]. The two-dimensional logarithmic normal
distribution of the length L and breadth B of the particles also allows the representation and calculation of the characteristic parameters and mean values. The eccentricity of the calculated standard deviation ellipse (Figure 1.2) is a measure of the correlation between the length and breadth of the particle. By using more than two particle fineness parameters, this principle can be further extended in a similar manner. The effect of particle size on optical properties of pigments is described in Section 1.3.
 Fig. 1.2 Standard deviation ellipses of a logarithmic normal distribution (yellow iron oxide pigment). Lz, Bz = median of L, B.
1.2.2
 22 августа, 2015
  Pokraskin
  Опубликовано в рубрике